In the age of sustainability, solar energy is leading the global clean-energy revolution. For solar companies, project managers, and renewable-energy consultants, tracking performance data accurately is the key to maximizing efficiency and profitability. The Solar Energy KPI Scorecard in Excel is a ready-to-use, interactive template that transforms raw solar data into clear, actionable insights.
Built entirely in Microsoft Excel, this scorecard helps you monitor every vital solar metric — from energy generation and conversion efficiency to downtime and ROI — all within one smart, automated workbook. No coding or expensive software required — just pure Excel power for precise performance tracking.
Whether you manage rooftop installations or operate utility-scale plants, this tool simplifies solar analytics, improves decision-making, and supports sustainability reporting. 🌍⚡
⚙️ Key Features of the Solar Energy KPI Scorecard in Excel
📊 Four Core Sheets: Scorecard Dashboard, KPI Trend, Input Data, and KPI Definition.
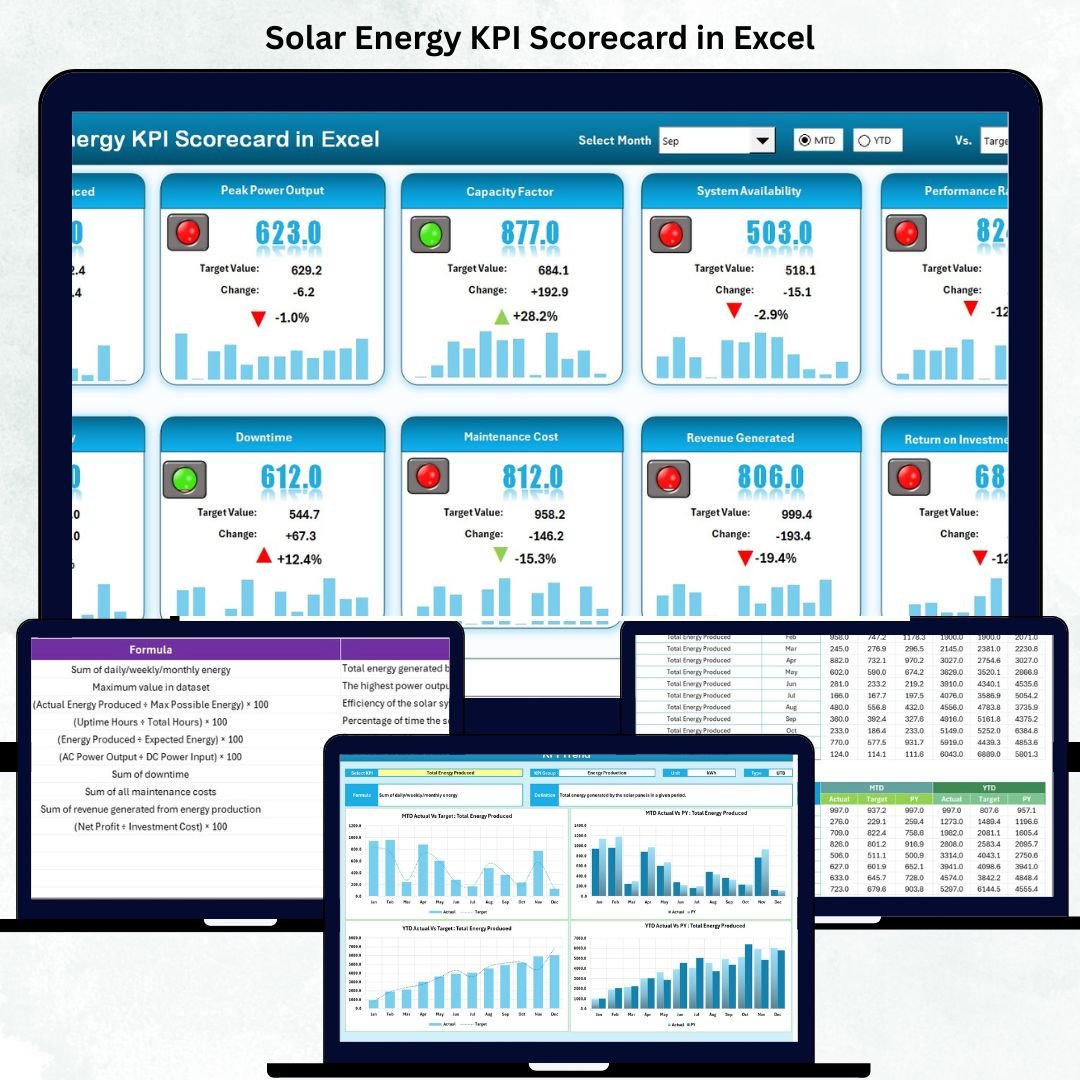
📅 Month Selector: Toggle between MTD and YTD to view monthly or annual performance.
🎯 Actual vs Target Comparison: Instantly see gaps between expected and achieved results.
🟢🟡🔴 Color Indicators: Green = On Target | Yellow = Near Target | Red = Below Target.
📈 Trend Charts: View Actual, Target, and Previous Year trends for each KPI.
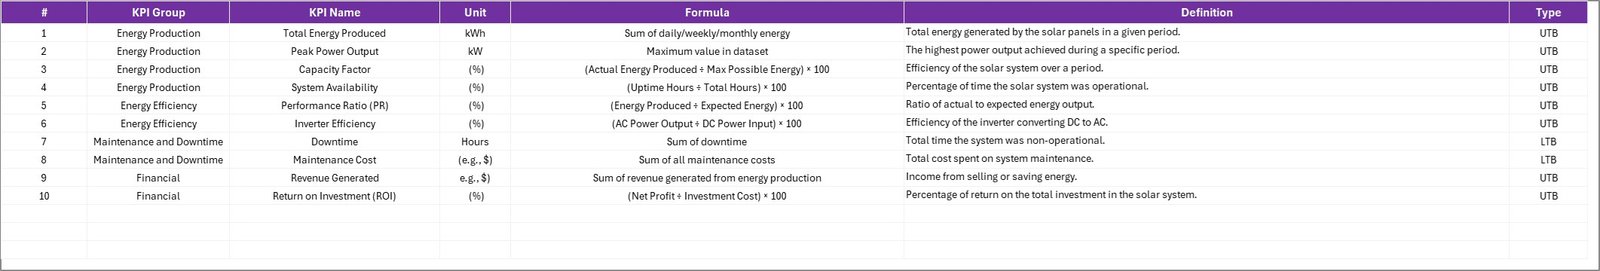
🔍 KPI Library: Includes formula, definition, and unit for every metric.
💡 Auto-Updates: Change the month or data once — the entire dashboard refreshes.
✅ Fully Editable: Add, remove, or rename KPIs without breaking the model.
💻 Cross-Platform: Compatible with Excel 2013+, Microsoft 365, Windows & Mac.
📊 What’s Inside the Scorecard
☀️ 1️⃣ Scorecard Sheet – Your Solar Control Center
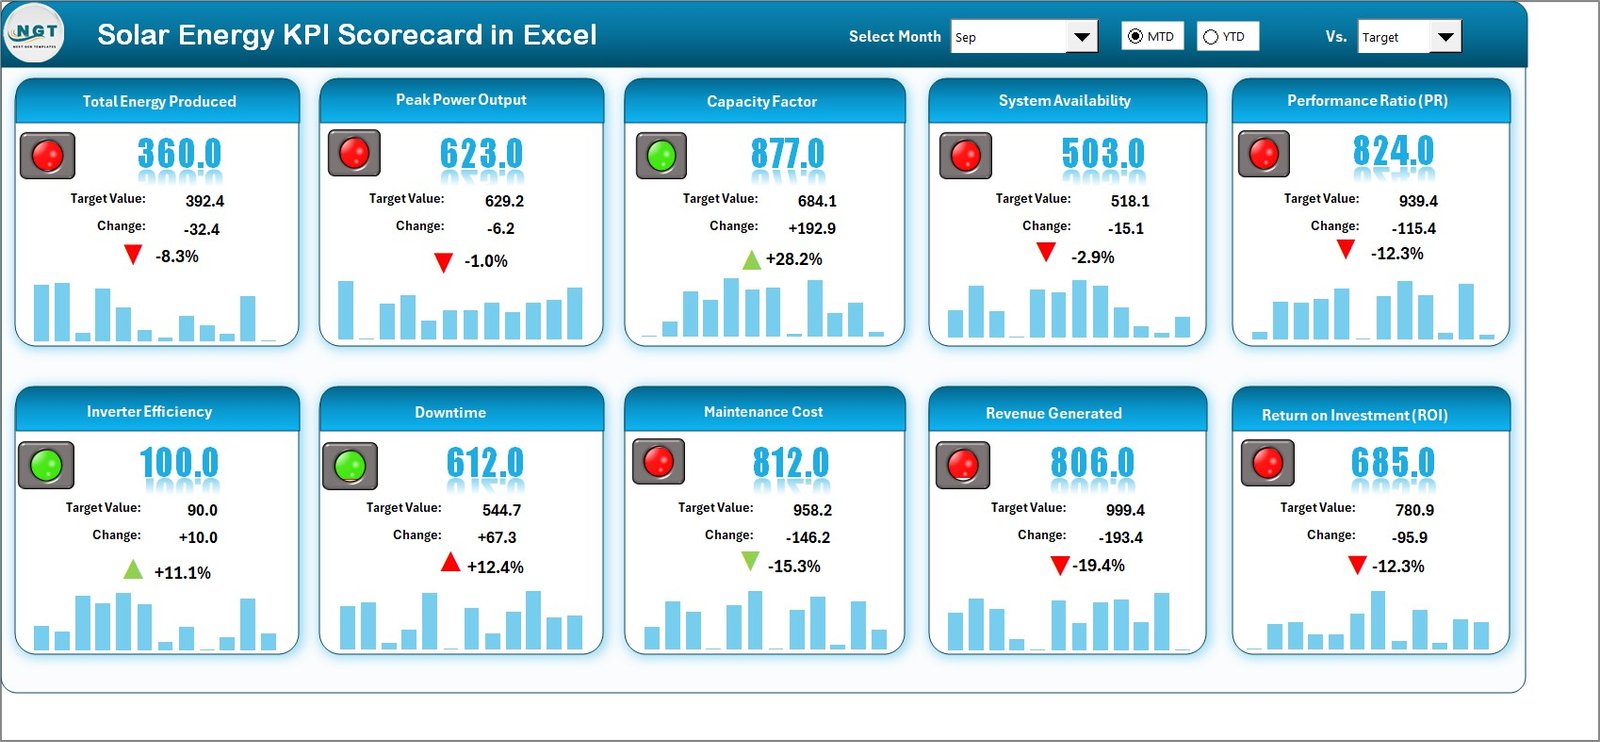
The main dashboard displays a complete snapshot of solar operations.
-
Select Month → Dashboard updates automatically.
-
Compare Actual vs Target vs Previous Year for MTD & YTD.
-
KPI cards show Total Energy Generated (kWh), Conversion Efficiency (%), and System Availability (%).
💡 Purpose: Monitor overall energy performance and identify sites that need attention.
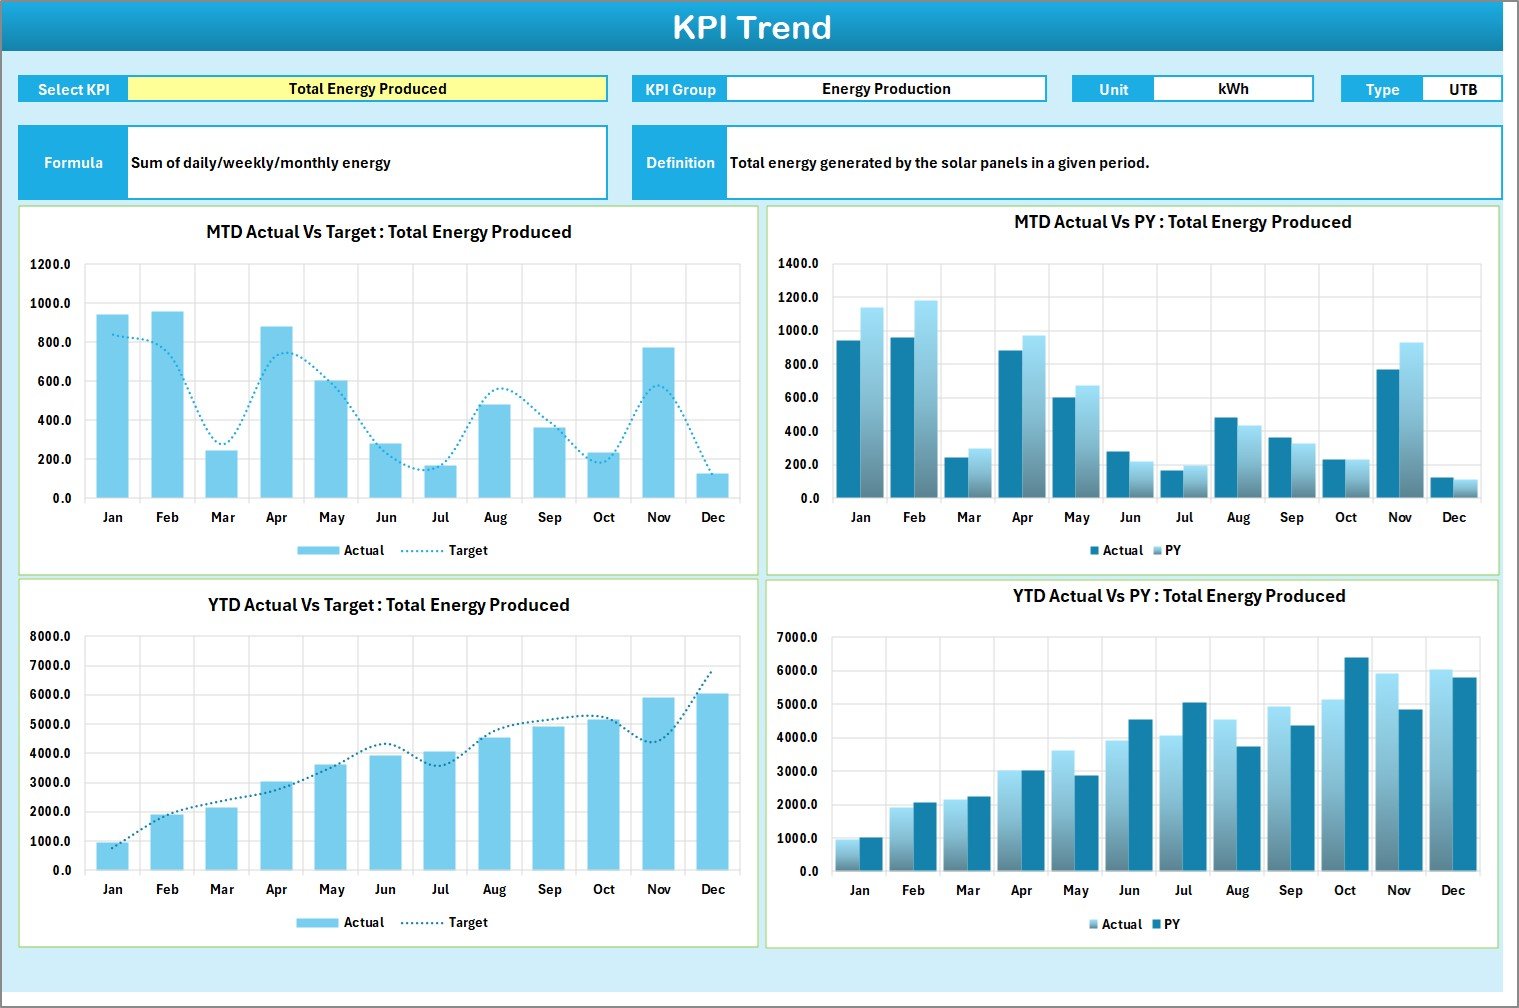
📈 2️⃣ KPI Trend Sheet – Deep Performance Insight
Drill down into individual KPIs to see how they evolve over time.
-
Dropdown (KPI Selector in cell C3).
-
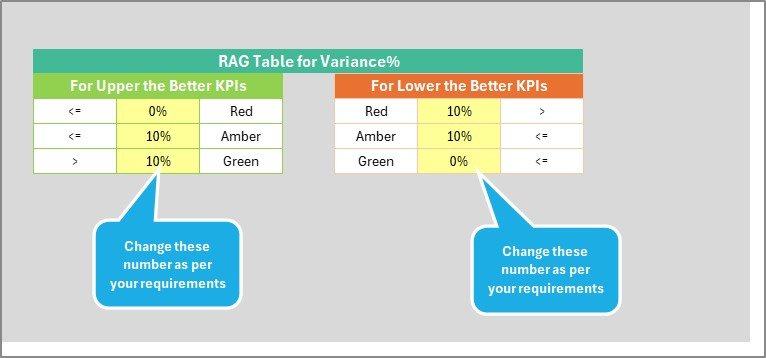
Displays KPI Group, Unit, Type (Upper or Lower Better), Formula & Definition.
-
MTD & YTD Trend Charts for Actual vs Target vs PY.
📊 Purpose: Identify seasonal variations and long-term performance patterns.
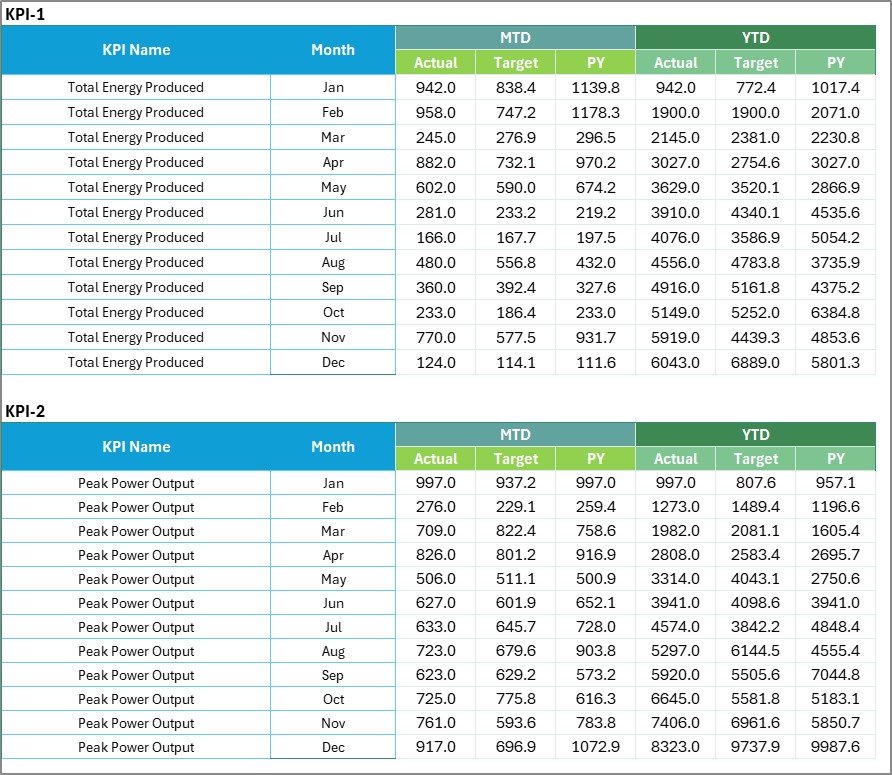
🧾 3️⃣ Input Data Sheet – Real-Time Data Entry Engine
-
Enter Actual and Target values monthly.
-
Automatic formula links update dashboard instantly.
-
Organized layout reduces errors and simplifies data management.
📅 Purpose: Serve as a single source of truth for all solar metrics.
📘 4️⃣ KPI Definition Sheet – The Knowledge Base
A reference guide listing every KPI with its formula, unit, definition, and performance type (↑ or ↓ better).
🧠 Purpose: Ensure clarity and standardization across teams and projects.
🌞 Key Solar KPIs Tracked
⚡ Energy Generation (kWh)
🌡️ Conversion Efficiency (%)
🔋 System Availability (%)
⏱️ Downtime Hours (hrs)
💰 Maintenance Cost (USD)
💡 ROI on Solar Assets (%)
🌿 CO₂ Emission Reduction (tons)
🏗️ Capacity Utilization Rate (%)
🌟 Advantages of Using This Scorecard
✅ Centralized Performance View – All your solar KPIs in one Excel file.
✅ Data-Driven Decisions – Visual trends reveal issues before they escalate.
✅ Cost-Effective Analytics – No need for costly software or licenses.
✅ Customizable & Scalable – Adapt to small rooftop systems or multi-plant operations.
✅ Sustainability Reporting – Track green metrics for ESG or CSR reports.
✅ Instant Updates – Automatic formula refresh on data entry.
✅ Professional Presentation-Ready Design – Ideal for reviews and investor meetings.
💡 Best Practices for Using the Scorecard
📌 Define realistic targets for each KPI.
📌 Update data monthly for accurate trends.
📌 Keep unit formats consistent (kWh, %, USD).
📌 Review Trend Charts to spot deviations early.
📌 Use conditional formatting for visual alerts.
📌 Back up data regularly to retain historical records.
📌 Involve team members in monthly performance reviews.
👥 Who Can Benefit from This Template
🌞 Solar Energy Companies
🏭 Renewable Plant Operators
🔧 Maintenance Teams
📊 Energy Consultants & Auditors
🌍 Sustainability Managers
🎓 Educational Institutions in Renewable Studies
🧩 Conclusion
The Solar Energy KPI Scorecard in Excel is your all-in-one solution for tracking and optimizing solar performance. By combining data automation, interactive visuals, and Excel’s flexibility, it delivers the clarity you need to boost output, reduce costs, and support sustainable growth.
☀️ Turn your solar data into powerful insights — and let the numbers shine!


Reviews
There are no reviews yet.