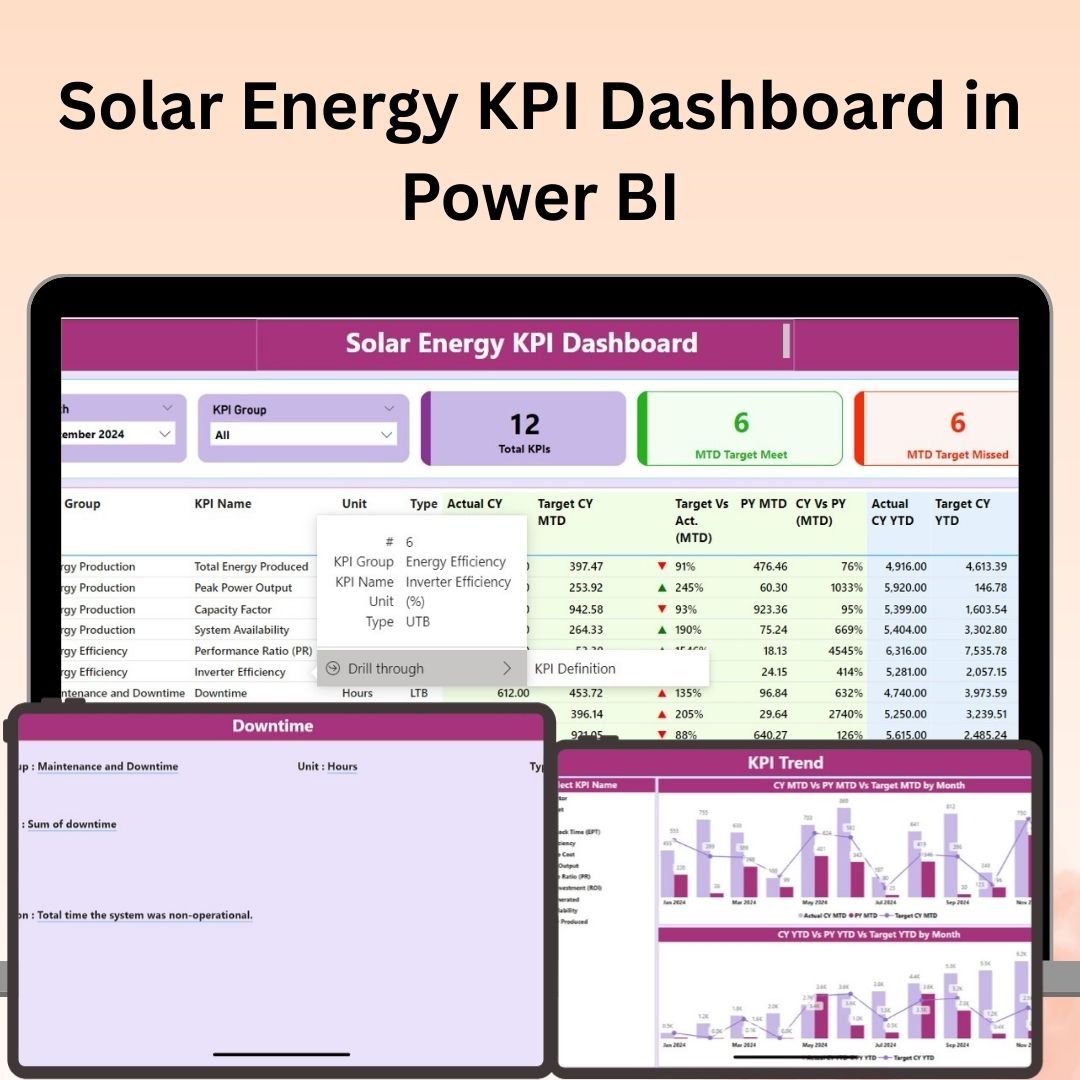
The Solar Energy KPI Dashboard in Power BI is an essential tool for solar energy providers, project managers, and sustainability experts who want to track, analyze, and optimize their solar energy performance. This Power BI dashboard is designed to monitor key performance indicators (KPIs) such as energy generation, system efficiency, cost savings, and environmental impact, offering real-time insights into solar energy production and usage.
With this interactive and visually appealing dashboard, users can quickly assess the performance of solar panels, track energy savings, and evaluate the environmental benefits of solar installations. Whether you’re managing a single solar project or overseeing a large-scale solar energy initiative, this dashboard provides a comprehensive solution for decision-makers and analysts to optimize solar energy operations.
Key Features of the Solar Energy KPI Dashboard in Power BI:
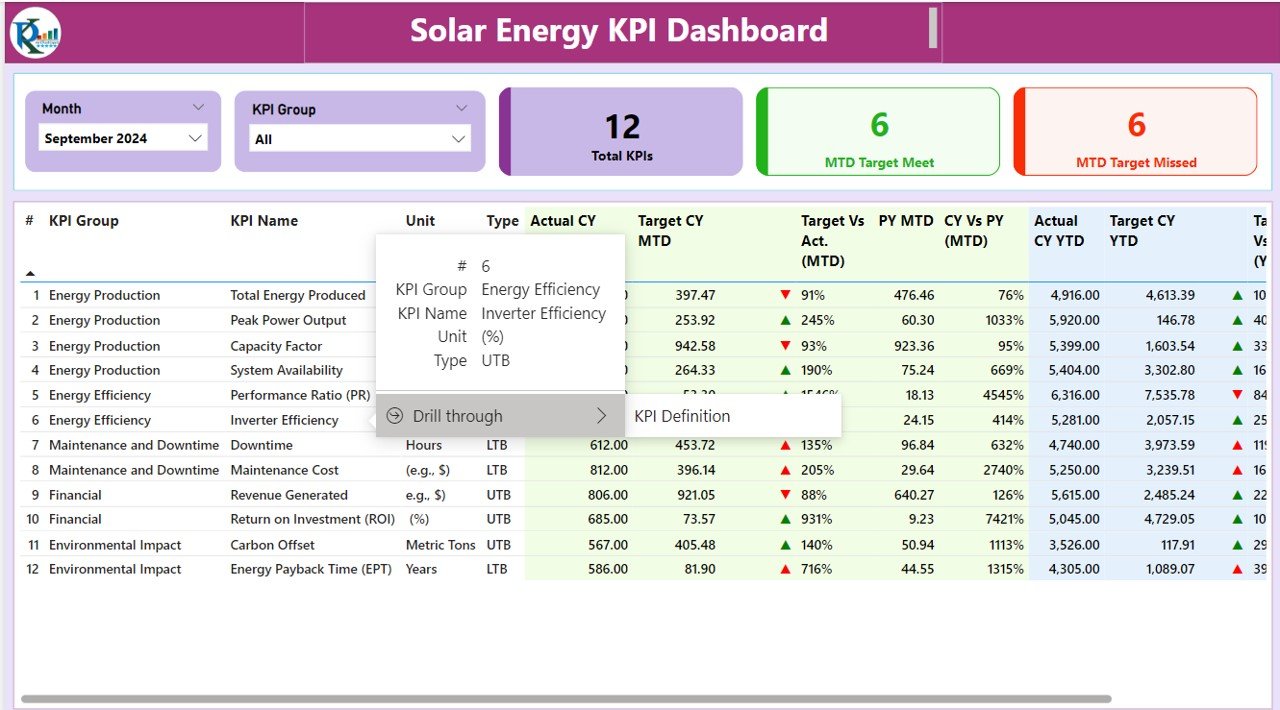
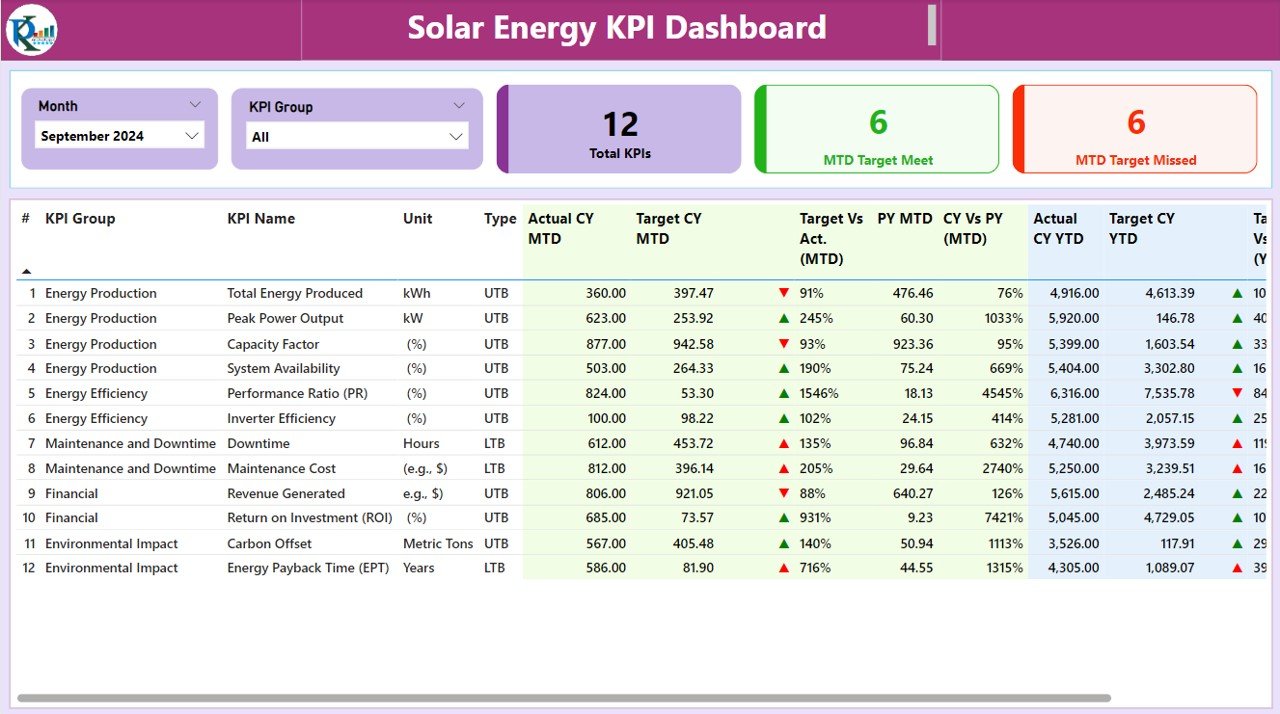
☀️ Real-Time Energy Production Tracking
Track solar energy generation in real time, including metrics like energy output, peak production times, and energy consumption.
📊 System Efficiency Metrics
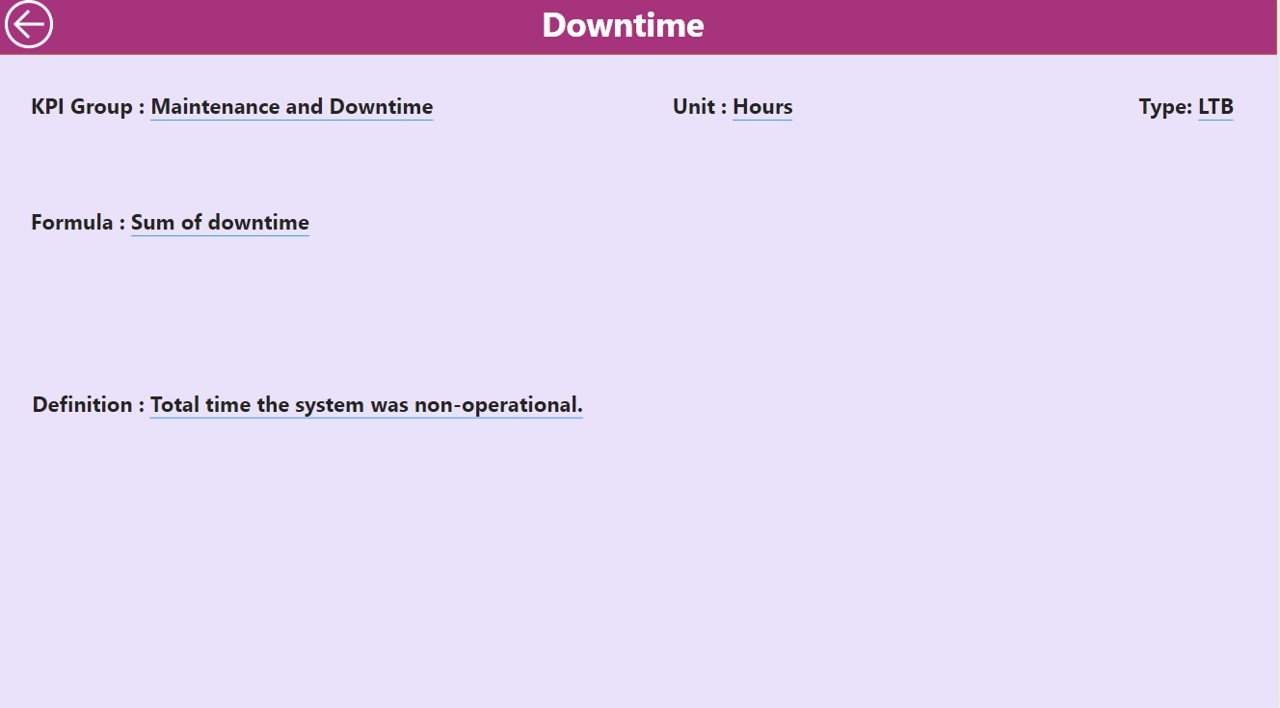
Monitor key system efficiency indicators, such as energy loss, conversion efficiency, and system uptime, to ensure that your solar energy systems are operating at peak performance.
💰 Cost Savings & ROI
Track the financial benefits of solar energy, including cost savings from reduced energy consumption, ROI (return on investment), and payback period calculations.
🌍 Environmental Impact Analysis
Measure the environmental benefits of your solar energy system, such as CO2 reduction and energy offset, to highlight the positive impact of solar energy on the environment.
⚡ Energy Storage and Distribution
Monitor the status of energy storage systems and how efficiently the stored energy is distributed, ensuring that excess energy is optimized for use or storage.
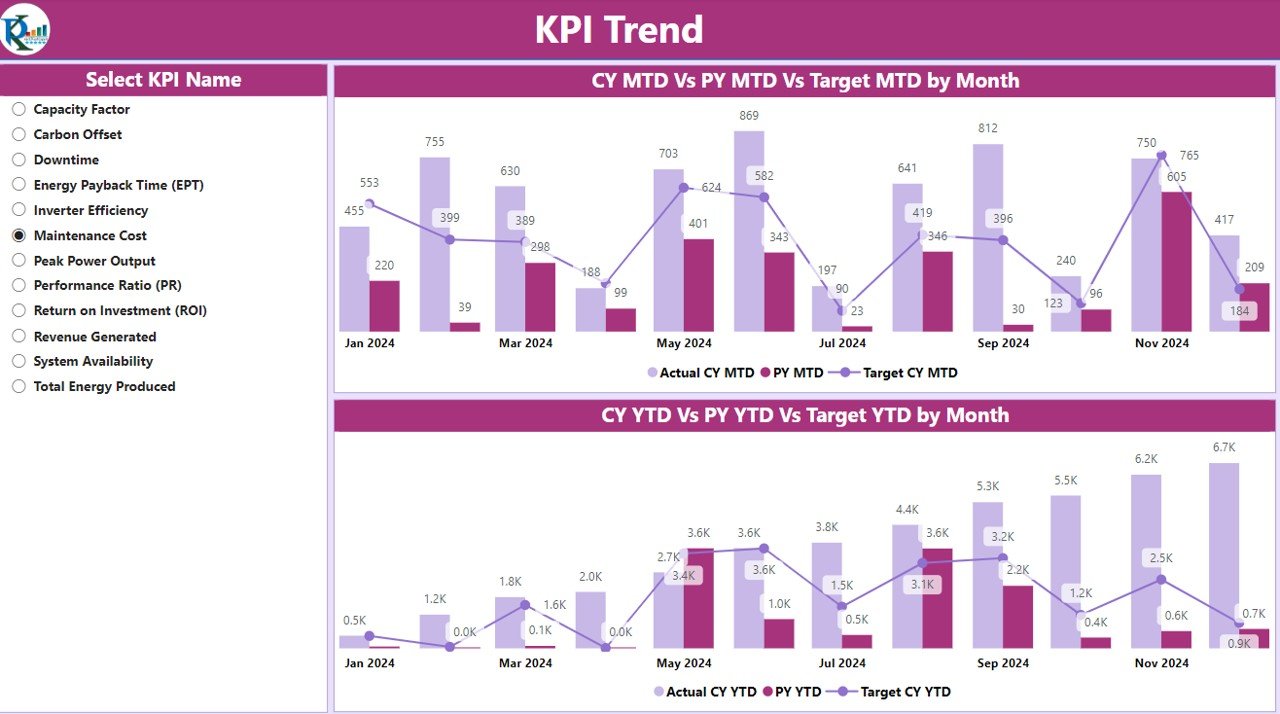
📈 Interactive Data Visualization
With interactive charts, graphs, and KPIs, this dashboard offers a visually rich experience to better understand trends, performance, and operational improvements.
🚀 Why You’ll Love the Solar Energy KPI Dashboard in Power BI:
✅ Track Solar Performance – Monitor key metrics like energy generation, system efficiency, and environmental impact in real time.
✅ Optimize Energy Production – Identify patterns in solar output and system efficiency to optimize energy production and storage strategies.
✅ Measure Financial Impact – Track cost savings, ROI, and financial benefits from solar energy systems to understand the financial performance of your projects.
✅ Improve Environmental Sustainability – Evaluate the environmental benefits of your solar systems and highlight your contribution to sustainability efforts.
✅ User-Friendly and Interactive – Power BI’s interactive interface makes it easy to customize the dashboard to suit your solar energy system’s specific needs and performance metrics.
✅ Customizable for Any Solar Project – Whether you’re managing residential, commercial, or large-scale solar installations, this dashboard is adaptable to fit any project.
What’s Inside the Solar Energy KPI Dashboard in Power BI:
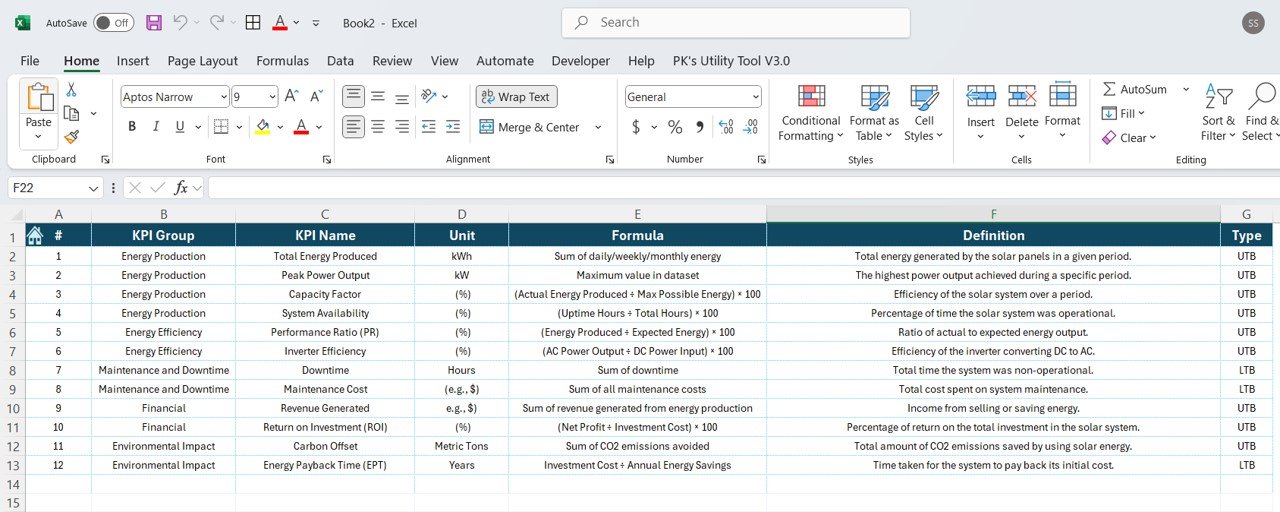
- Energy Production Tracker: Track solar energy generation in real time, including peak production times and total energy output.
- System Efficiency Metrics: Monitor the conversion efficiency, uptime, and energy loss to ensure maximum system performance.
- Cost Savings & ROI: Track the financial benefits of solar energy, including savings from reduced energy bills and overall ROI.
- Environmental Impact: Measure the reduction in CO2 emissions and energy offset to quantify the environmental benefits of your solar systems.
- Energy Storage and Distribution: Track energy storage levels and the efficiency of energy distribution, ensuring that energy is used optimally.
- Interactive Reporting: Visualize key data through interactive charts and graphs, offering a clear and comprehensive view of your solar energy system’s performance.
How to Use the Solar Energy KPI Dashboard in Power BI:
1️⃣ Download the Template – Access your Power BI file upon purchase.
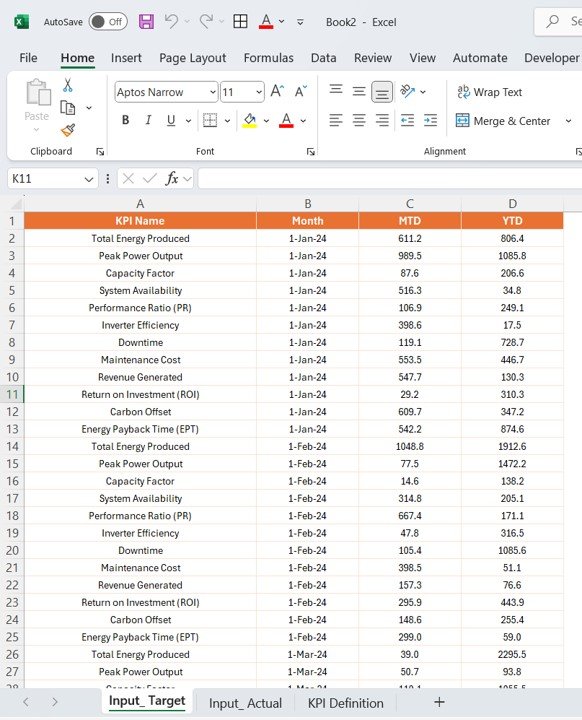
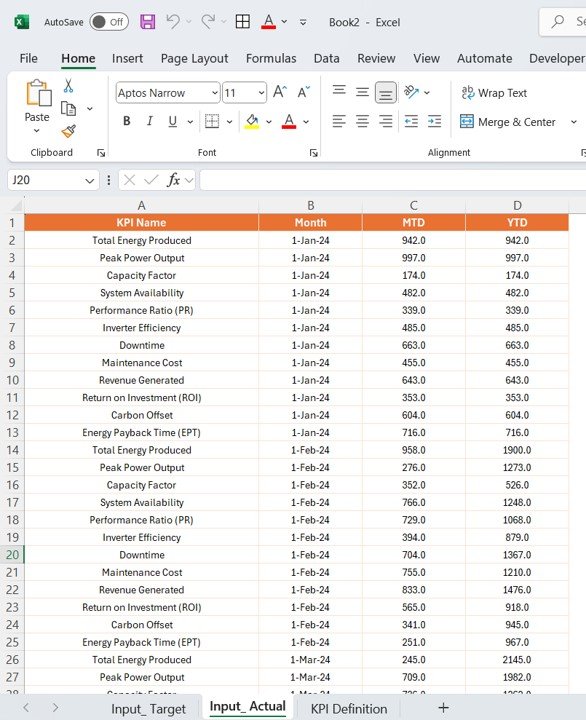
2️⃣ Import Solar Energy Data – Populate the dashboard with energy production, efficiency, cost, and environmental impact data from your solar systems.
3️⃣ Monitor Real-Time Data – Use the dashboard to track solar performance, efficiency, and financial savings in real time.
4️⃣ Analyze Trends and Patterns – Utilize interactive features to drill down into specific data points, trends, and areas for optimization.
5️⃣ Generate Reports – Easily create customized reports to share insights with stakeholders or make informed decisions for project improvements.
Who Can Benefit from the Solar Energy KPI Dashboard in Power BI:
- Solar Energy Providers
- Project Managers
- Sustainability Experts
- Energy Analysts
- Environmental Consultants
- Commercial and Residential Solar Installers
- Utility Companies
- Government and Regulatory Bodies
The Solar Energy KPI Dashboard in Power BI is a powerful tool for anyone managing or overseeing solar energy systems. Whether you are tracking system efficiency, monitoring financial impact, or measuring environmental benefits, this dashboard provides the insights you need to make informed decisions and optimize solar energy operations.
Click here to read the Detailed blog post
https://www.pk-anexcelexpert.com/solar-energy-kpi-dashboard-in-power-bi/
Visit our YouTube channel to learn step-by-step video tutorials
Youtube.com/@PKAnExcelExpert


Reviews
There are no reviews yet.