


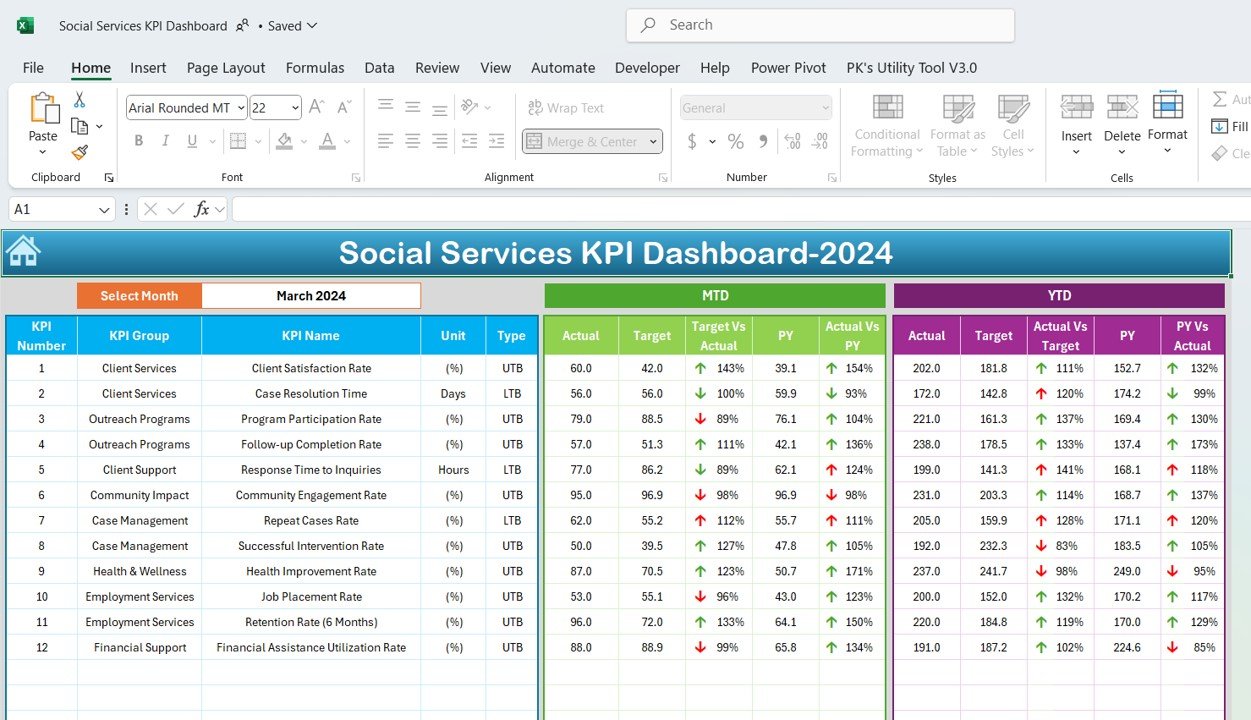
The Social Services KPI Dashboard in Power BI is a comprehensive tool designed to help social service organizations track and analyze key performance indicators (KPIs) essential to their operations. Whether you’re managing public health initiatives, community services, or government-sponsored programs, this Power BI dashboard provides the data-driven insights necessary for improving service delivery and achieving organizational goals.
This dashboard enables you to monitor a range of performance metrics such as client satisfaction, case management, funding utilization, and program effectiveness. With real-time data integration, this tool allows you to track progress, identify areas for improvement, and make informed decisions to enhance the quality of social services provided to the community.
Key Features of the Social Services KPI Dashboard in Power BI
📊 Comprehensive KPI Tracking
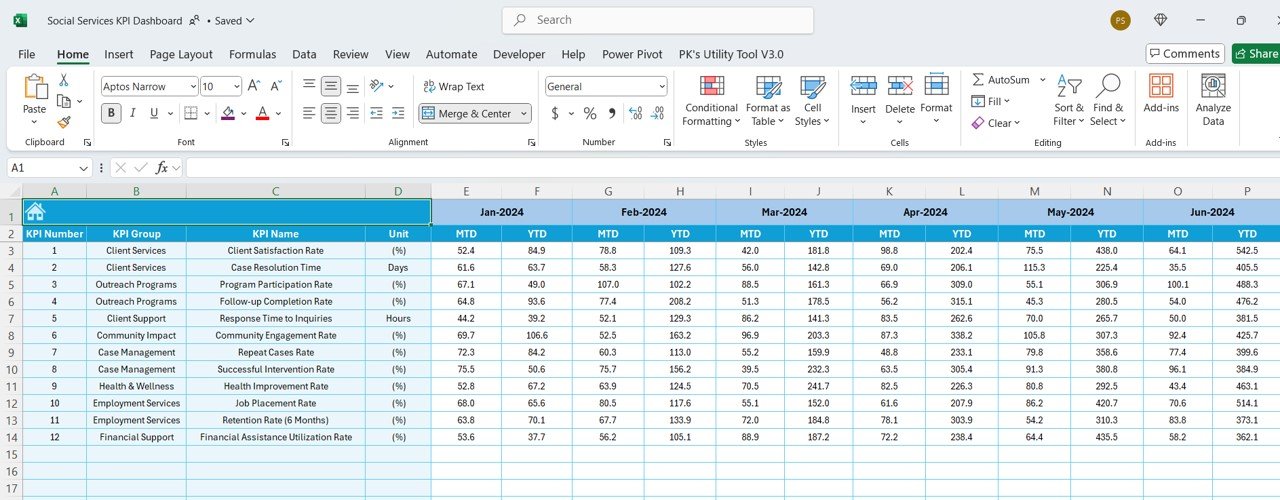
Track essential social service KPIs such as client engagement, case resolution rates, service delivery time, and funding allocation. Monitor progress and efficiency with real-time data.
📈 Client Satisfaction & Feedback Analysis
Measure the level of client satisfaction through surveys, feedback, and outcome assessments. Track client retention and service quality to improve overall satisfaction.
💡 Program Effectiveness Monitoring
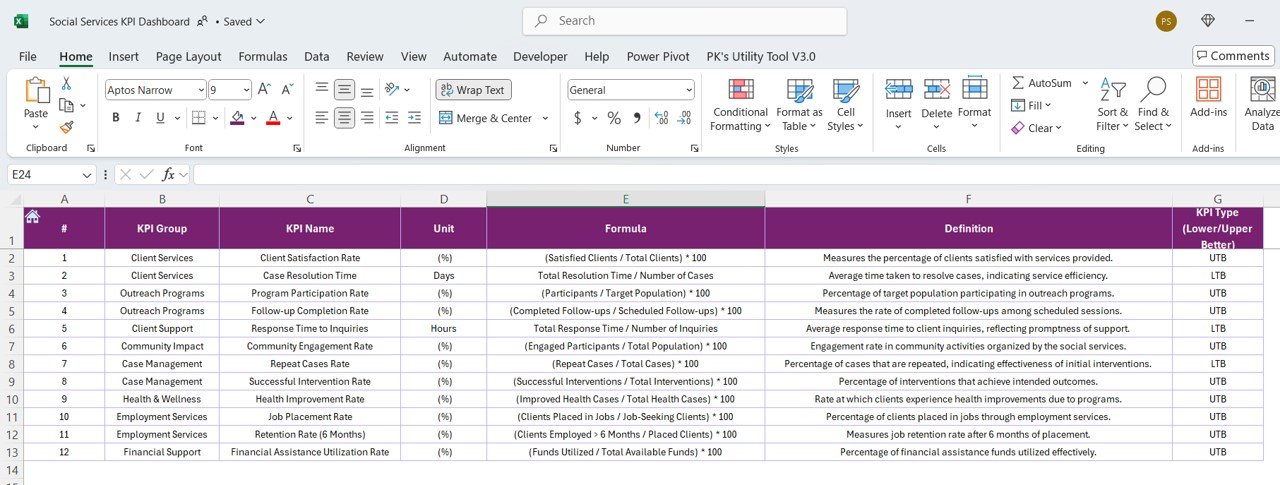
Evaluate the effectiveness of various programs by tracking key outcomes, such as the number of clients served, the impact of services, and program completion rates.
⚙️ Funding & Resource Allocation
Monitor the utilization of resources and funding, ensuring that budgets are spent efficiently and in line with the goals of the social service programs.
⏱ Time-Based Performance Analysis
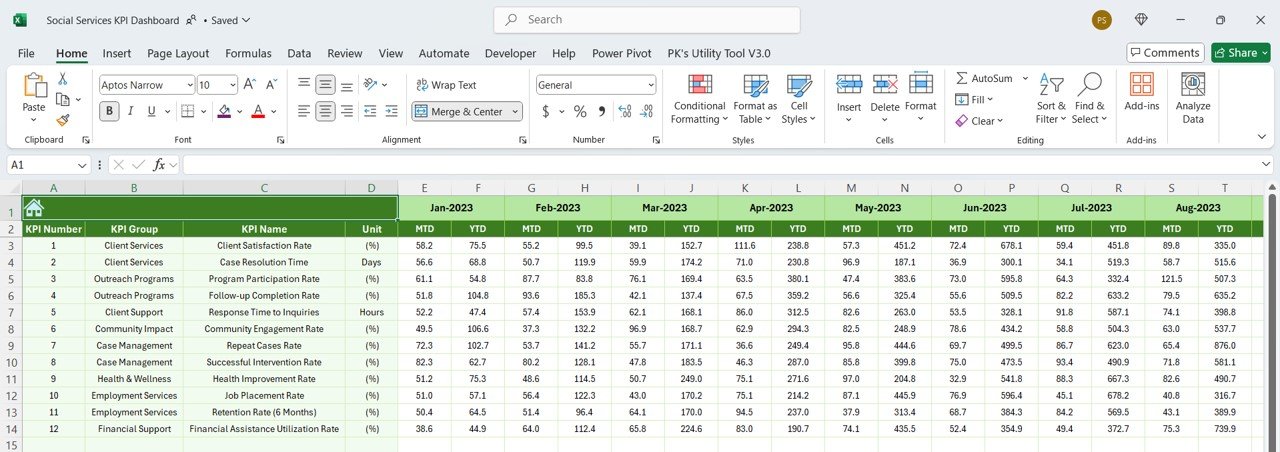
Assess performance over different time periods—daily, weekly, monthly, or yearly. Use this feature to identify trends and improve long-term outcomes for social services.
🔑 Real-Time Data Integration
Integrate data from various sources including client records, program databases, and financial systems to get up-to-date insights for better decision-making.
Why You’ll Love the Social Services KPI Dashboard in Power BI
✅ Holistic View of Social Service Performance
Track all essential KPIs in one place to get a comprehensive view of the effectiveness and efficiency of your social service programs.
✅ Data-Driven Decision Making
Use insights from the dashboard to make informed decisions about resource allocation, program improvements, and client services.
✅ Increase Program Impact & Efficiency
Monitor client satisfaction, funding, and service delivery to optimize programs and improve overall service delivery.
✅ Improve Accountability & Transparency
Ensure that services are delivered effectively and efficiently by tracking key performance metrics and generating transparent reports.
✅ Customizable for Any Social Service Organization
Customize the dashboard to reflect the specific goals and KPIs of your organization. It’s flexible and scalable to fit both small and large social service initiatives.
What’s Inside the Social Services KPI Dashboard in Power BI?
-
Comprehensive KPI Tracking: Track key metrics like client engagement, case resolution rates, and service delivery time.
-
Client Satisfaction & Feedback Analysis: Monitor client satisfaction and feedback to improve service quality.
-
Program Effectiveness Monitoring: Evaluate the impact and completion rates of social service programs.
-
Funding & Resource Allocation: Track the utilization of funding and resources in real time.
-
Time-Based Performance Analysis: Monitor performance trends over various time periods.
-
Real-Time Data Integration: Integrate data from various social service systems for updated insights.
How to Use the Social Services KPI Dashboard in Power BI
1️⃣ Download the Template: Get the Social Services KPI Dashboard in Power BI instantly.
2️⃣ Integrate Your Data Sources: Link client, program, and funding data to the dashboard for real-time updates.
3️⃣ Track KPIs & Performance: Monitor metrics such as service delivery time, client satisfaction, and funding usage.
4️⃣ Analyze Trends & Data: Use time-based analysis to identify performance trends and gaps.
5️⃣ Optimize Social Service Delivery: Use insights to optimize program effectiveness and resource allocation.
Who Can Benefit from the Social Services KPI Dashboard in Power BI?
🔹 Social Service Organizations & Agencies
🔹 Nonprofits & Charities
🔹 Government Health & Social Service Departments
🔹 Community Program Managers
🔹 Nonprofit Executives & Program Directors
🔹 Funding Organizations & Grant Managers
🔹 Healthcare Providers with Social Service Programs
Enhance your social service programs and improve client outcomes with the Social Services KPI Dashboard in Power BI. Track and optimize KPIs related to service delivery, client satisfaction, program effectiveness, and funding allocation.
Click here to read the Detailed blog post
Visit our YouTube channel to learn step-by-step video tutorials
Youtube.com/@PKAnExcelExpert


Reviews
There are no reviews yet.