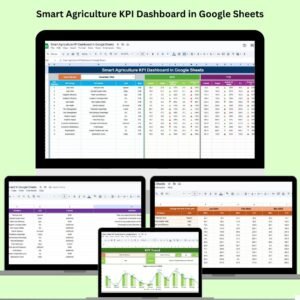
In modern agriculture, data is as important as dirt. From increasing yields to managing water usage, having a real-time view of what’s working and what’s not is essential. That’s where the Smart Agriculture KPI Dashboard in Google Sheets comes in—a powerful, easy-to-use tool designed for farmers, agribusiness managers, and agricultural consultants who want to turn raw data into better harvests and smarter decisions.
This ready-to-use, interactive template helps you monitor crop yield, resource usage, labor efficiency, financial returns, and more—all in one place. Built entirely in Google Sheets, it offers real-time collaboration, cloud access, and fully customizable KPI tracking.
🌟 Key Features of the Smart Agriculture KPI Dashboard
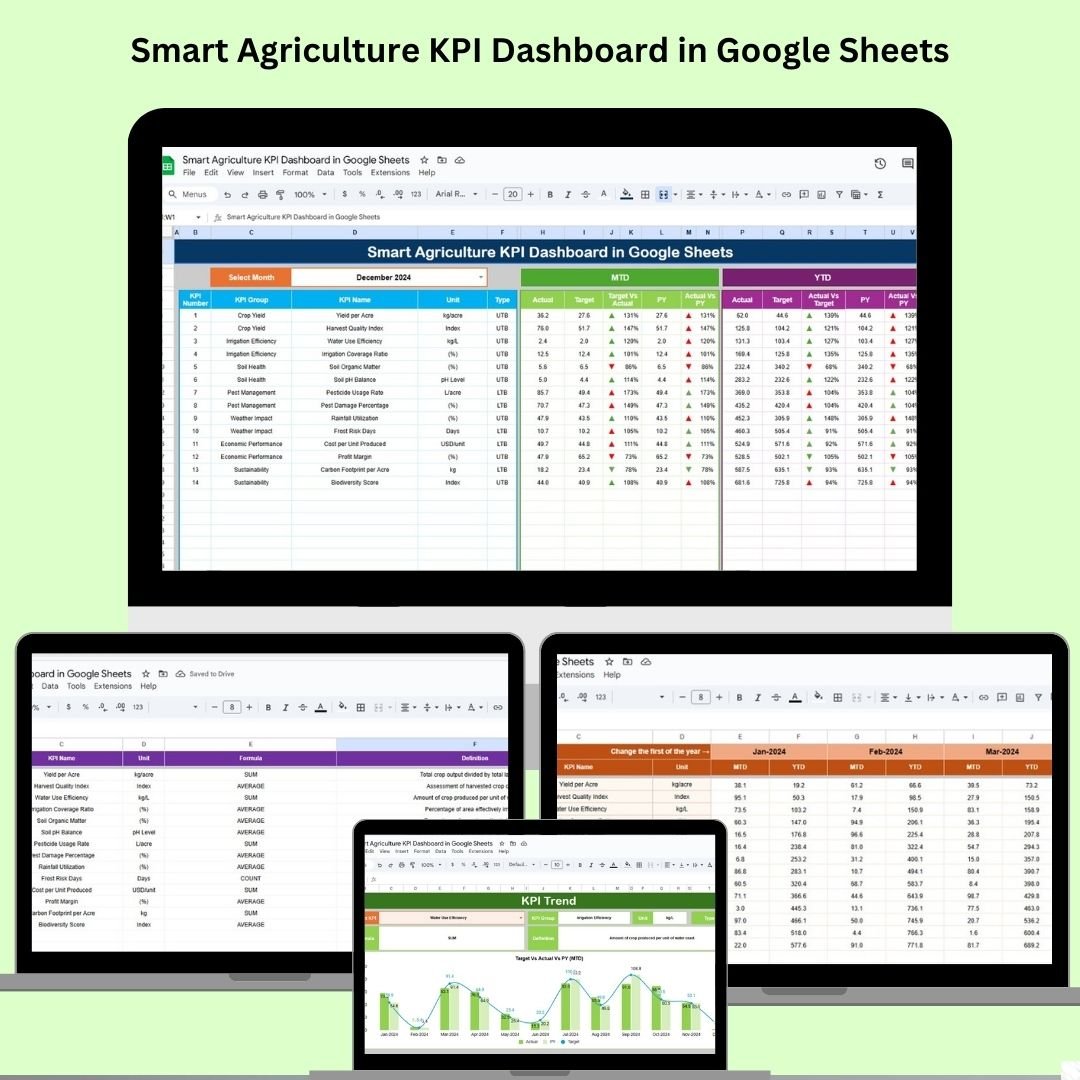
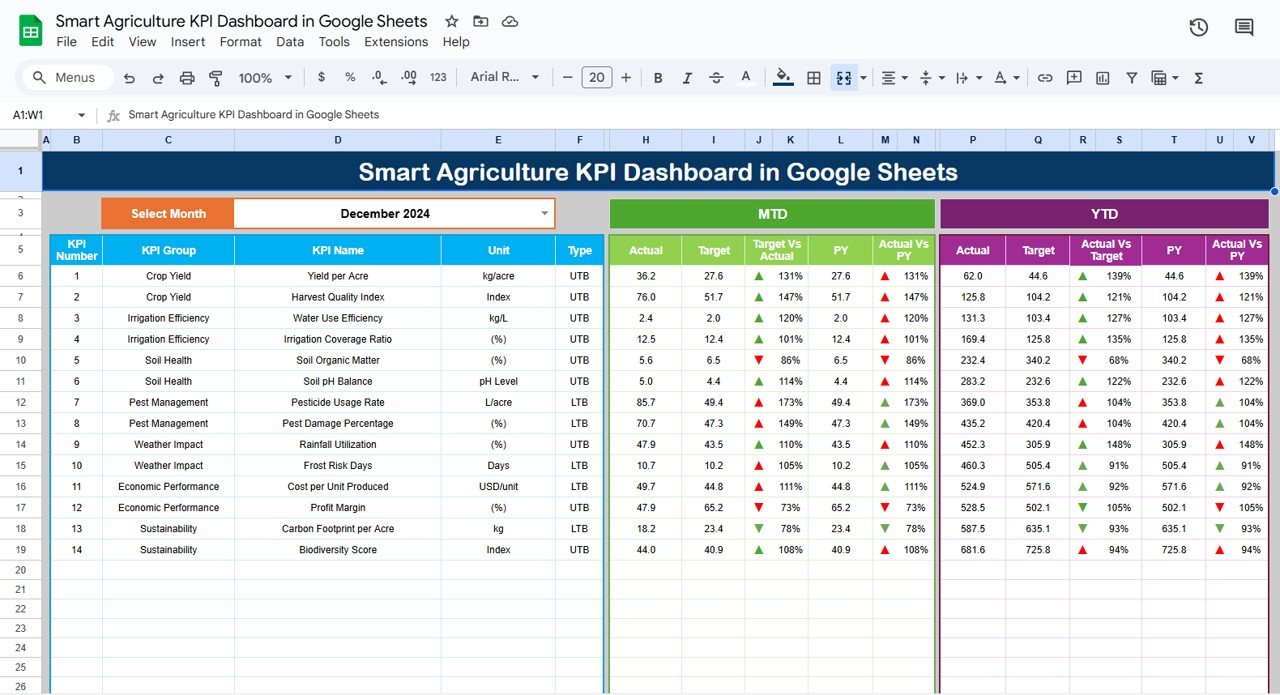
📊 Dashboard Overview
Your main command center! The dashboard sheet provides:
-
MTD (Month-to-Date) and YTD (Year-to-Date) performance
-
📉 Actual vs Target comparison
-
🔺 Conditional formatting (green/red arrows) to show KPI status
-
📅 PY vs Actual comparisons for year-over-year insights
Visual, interactive, and no-code required!
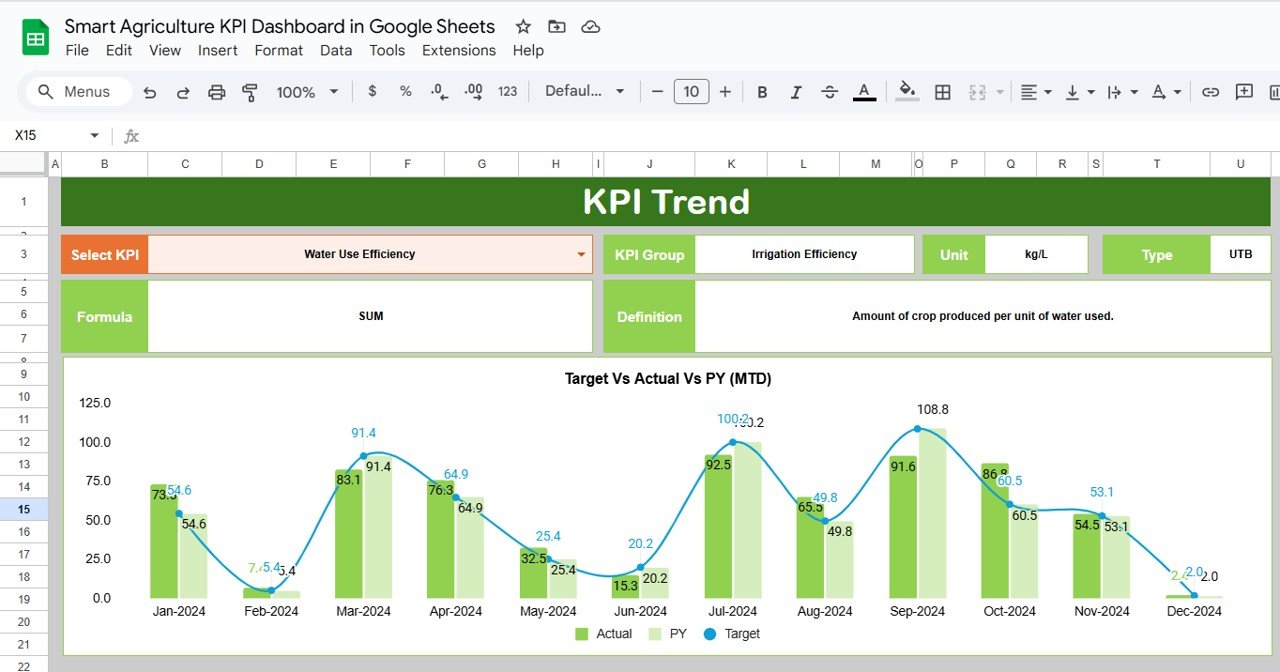
📈 KPI Trend Sheet
Want to know how a specific KPI has performed over time? Use the trend sheet to:
-
🧠 Select KPIs via dropdown
-
💡 View KPI Group, Unit, Formula, Type (LTB or UTB)
-
📘 Understand each KPI with clear definitions
It’s your trend-tracking powerhouse for forecasting and pattern recognition.
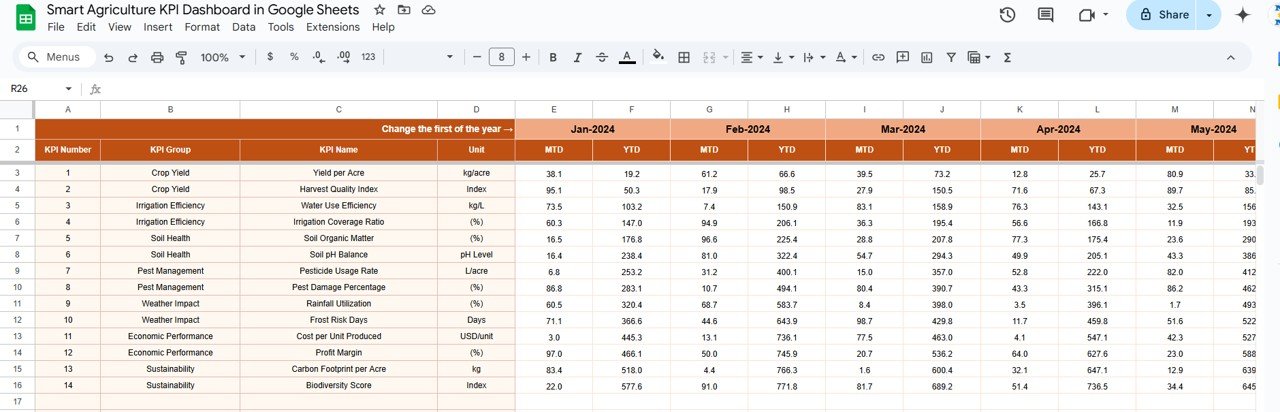
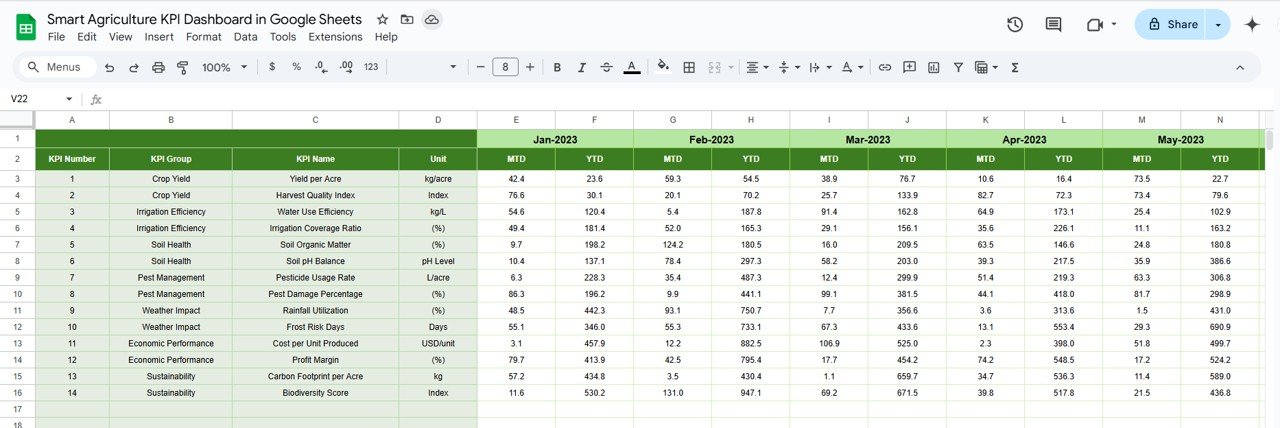
🧾 Actual Number Sheet
Input real-time operational data here:
-
🚜 Crop yield, water usage, labor hours, and more
-
🧮 MTD & YTD values drive the dashboard automatically
-
📆 Monthly selection keeps the data organized and updated
🎯 Target Sheet
Set your monthly and yearly performance goals here:
-
🌽 Input target crop yield, resource efficiency, revenue, etc.
-
🧭 Compare goals with actuals to spot gaps and progress
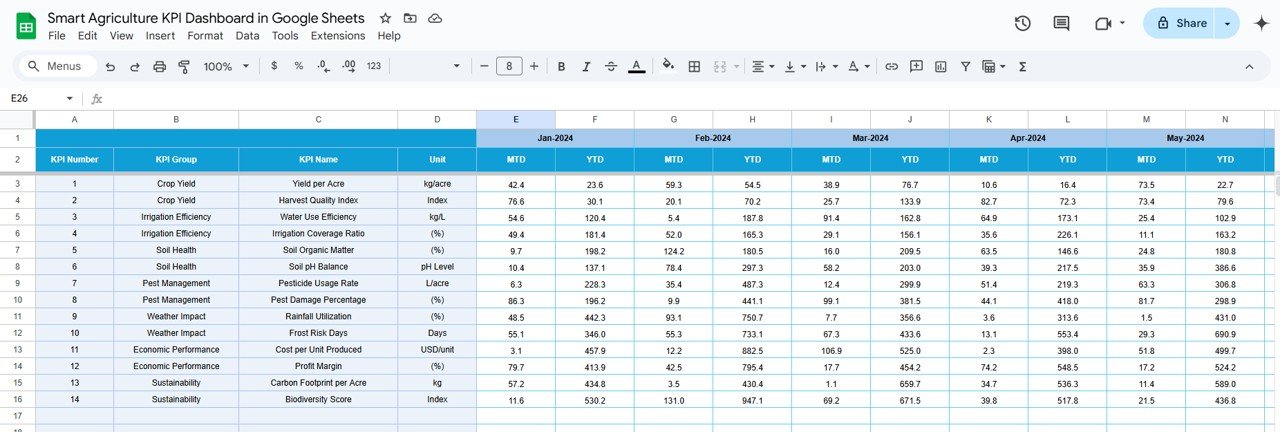
🔄 Previous Year Data Sheet
Benchmark current performance against last year:
-
🕒 Enter past values for YTD & MTD
-
📊 Instantly see year-over-year growth or areas needing attention
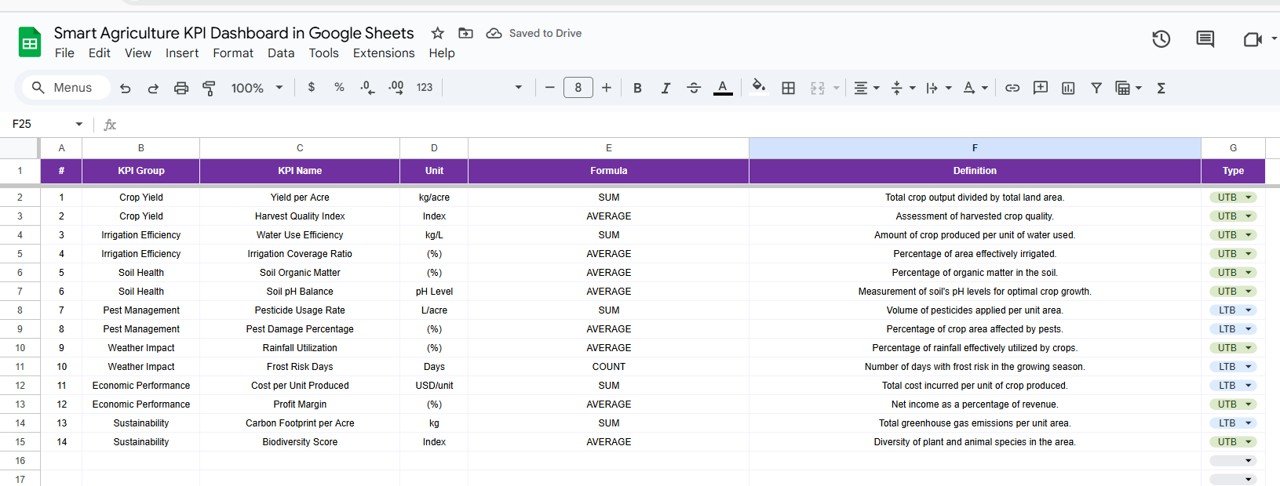
📘 KPI Definition Sheet
Confusion-free zone! Each KPI is:
-
Clearly defined with formula, unit, and purpose
-
Categorized for quick understanding
-
Perfect for team alignment and reporting clarity
📦 What You’ll Get
-
✅ A fully functional Google Sheets KPI dashboard
-
📊 Real-time overview of agricultural performance
-
🔁 Editable fields for Actual, Target, and PY data
-
📈 KPI trend charting with dropdown filtering
-
📘 A master sheet of KPI definitions
-
⚙️ 100% customizable to your farm or agribusiness needs
👨🌾 Who Is This Dashboard For?
This template is built for:
-
🚜 Farm owners and agricultural entrepreneurs
-
🌱 Sustainable farming projects
-
🧑💼 Agribusiness consultants and supply chain managers
-
🧪 Agri-research organizations
-
🌍 Eco-friendly agriculture initiatives
Whether you run a greenhouse, a vineyard, or a multi-acre wheat operation—this dashboard gives your numbers purpose.
💡 How to Use It
-
📥 Download the template & open in Google Sheets
-
✏️ Input MTD & YTD values in the Actual Number Sheet
-
🎯 Set goals in the Target Sheet
-
🔁 Add past performance in the Previous Year Sheet
-
📊 View updated insights automatically in the Dashboard
-
📘 Use the Trend and KPI sheets for deeper analysis
No coding. No apps. Just your data—working smarter for you.


Reviews
There are no reviews yet.