



Efficient port management is the backbone of global trade. To keep operations smooth and profitable, port authorities need real-time visibility into vessel movements, cargo flow, and resource utilization. The Shipping Port KPI Dashboard in Google Sheets provides a ready-to-use, data-driven solution that helps you track, analyze, and improve overall port performance — all within a collaborative and interactive Google Sheets environment. ⚓📊
This dashboard centralizes critical port KPIs such as vessel turnaround time, cargo throughput, and berth utilization, giving decision-makers the insights they need to enhance operational efficiency, reduce downtime, and optimize logistics workflows.

🔑 Key Features of the Shipping Port KPI Dashboard in Google Sheets
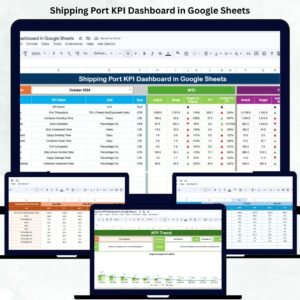
📋 Dashboard Sheet Tab (Main Performance View)
Get an instant snapshot of overall port performance with visual indicators and dynamic KPIs:
MTD (Month-to-Date) vs Target vs Previous Year: Evaluate short-term progress and track monthly changes.
YTD (Year-to-Date) vs Target vs Previous Year: Monitor annual cumulative performance.
Visual Arrows & Color Codes:
🟢 Green Arrow = Improvement
🔴 Red Arrow = Decline
🟡 Neutral/Stable = No major change
The dashboard automatically highlights trends, allowing port managers to quickly identify bottlenecks or underperforming areas.
📈 KPI Trend Sheet Tab
Dive deeper into individual KPI performance using interactive trend charts:
Select any KPI from a dropdown (Cell C3).
View historical data for multiple months.
Analyze patterns across time to understand performance behavior.
Each KPI displays its Group, Unit, Type (UTB/LTB), Formula, and Definition, ensuring clear understanding across teams.
🧾 Actual Number Sheet Tab
This tab holds actual operational data — MTD and YTD values.
Select the starting month (Cell E1).
Enter actual monthly figures for each KPI.
Data auto-updates across all visual dashboards.
📊 Target Sheet Tab
Define performance expectations by entering monthly and yearly targets.
This sheet enables variance analysis between Actual vs Target — empowering management to adjust goals dynamically.
📅 Previous Year Number Sheet Tab
Record previous year’s results to measure year-over-year growth or decline.
📘 KPI Definition Sheet Tab
Maintain a reference for all metrics with clearly defined details —
Group | KPI Name | Formula | Unit | Type (LTB/UTB).
This ensures data integrity and transparency across all teams.
📦 What’s Inside the Shipping Port KPI Dashboard
✅ Prebuilt Google Sheets File – Fully functional and ready to use
✅ Interactive Dashboard Page – Real-time KPI monitoring
✅ Automated Trend Charts – Compare monthly & yearly performance
✅ Color-Coded Indicators – Instant performance visualization
✅ Editable KPI Definition Sheet – Customize your own KPIs
✅ Targets vs Actual Comparison – Easy variance analysis
✅ Historical Performance Tracker – Year-over-year insights
✅ Cloud Collaboration – Multiple users can update in real time
Everything is plug-and-play — simply enter your port data and watch your dashboard come alive! 🚢💼
🧑💼 Who Can Benefit from This Dashboard
⚓ Port Authorities – Monitor overall port and terminal performance.
🚛 Logistics & Operations Managers – Optimize vessel turnaround and cargo handling.
📈 Executives & Analysts – Track trends and make data-driven decisions.
🏗️ Terminal Operators – Ensure efficient berth and equipment utilization.
This dashboard brings clarity, control, and collaboration to every level of port management.
🧪 How to Use the Shipping Port KPI Dashboard
1️⃣ Enter Actual Data: Update MTD & YTD numbers in the Actual Number Sheet.
2️⃣ Set Targets: Define monthly and yearly goals in the Target Sheet.
3️⃣ Track Trends: View KPI patterns in the Trend Sheet tab.
4️⃣ Analyze Performance: Compare current and previous year data.
5️⃣ Share Insights: Collaborate live with stakeholders or export as PDF reports.
💡 Pro Tip: Connect with Google Forms or APIs for automatic data imports from port systems!
🌟 Why Choose This Dashboard
Simplifies complex port data into actionable insights
Cloud-based collaboration for real-time performance tracking
Built-in comparison of MTD, YTD, and YoY data
Fully customizable KPI structure
Visual indicators make interpretation fast and intuitive
The Shipping Port KPI Dashboard in Google Sheets is your go-to solution for efficient, transparent, and scalable port performance management. 🌟
🔗 Click here to read the Detailed blog post
Watch the step-by-step video Demo:
🔗 Visit our YouTube channel for step-by-step tutorials
Compatibility and Requirements
- Works in Google Sheets. You need a free Google account and a web browser.
- You pick the KPI on the KPI Trend sheet and the starting month on the Actual Number sheet from dropdowns. Google explains dropdowns in Create an in-cell dropdown list.
Frequently Asked Questions
Which sheets are included?
Six sheets: Dashboard, KPI Trend, Actual Number, Target, Previous Year Number and KPI Definition.
How do I update the dashboard?
Enter your MTD and YTD figures in the Actual Number sheet and your monthly and yearly goals in the Target sheet. The Dashboard then compares them and updates its arrows and colors.
What do the arrows and colors mean?
A green arrow shows improvement, a red arrow shows a decline, and a yellow indicator means no major change.
Can I compare this year with last year?
Yes. Record last year’s results in the Previous Year Number sheet and the Dashboard shows MTD and YTD next to the target and the previous year.
Is there an Excel version?
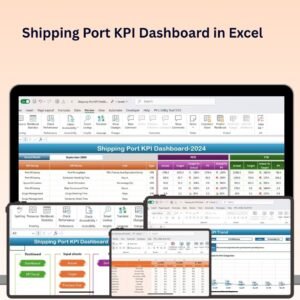
Yes. See the Shipping Port KPI Dashboard in Excel.
Related Logistics and Dashboard Templates
- Shipping Port KPI Dashboard in Excel: the same port KPIs in Excel
- Transportation & Logistics Dashboard in Excel: a logistics view in Excel
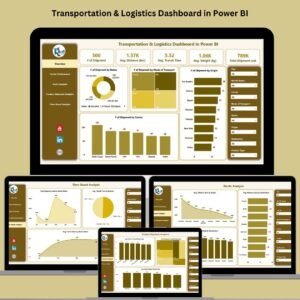
- Transportation & Logistics Dashboard in Power BI: the Power BI edition
- Logistics and Transportation Hub: 7 logistics templates in one download
Browse all Google Sheets KPI dashboards or the Google Sheets category.















Reviews
There are no reviews yet.