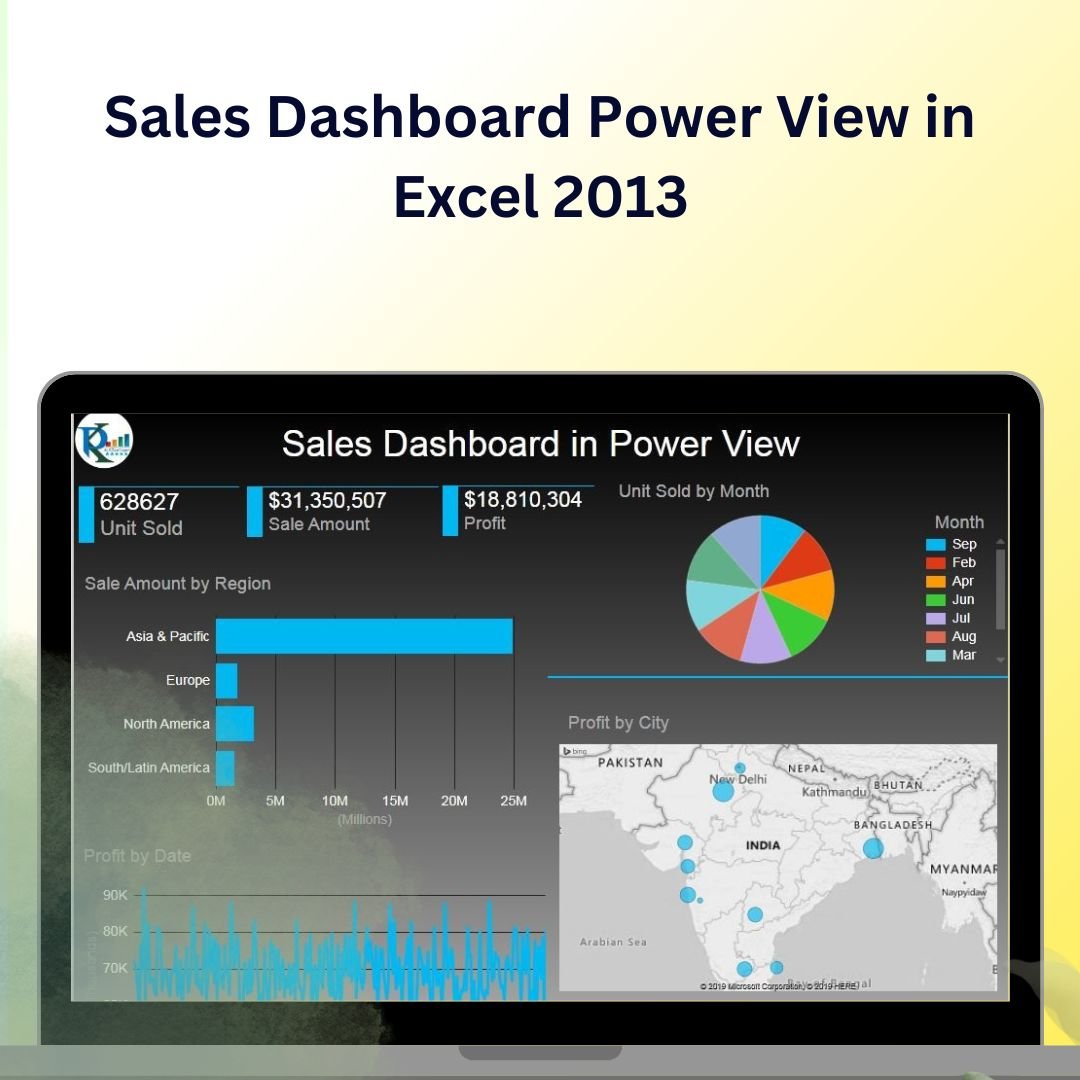
The Sales Dashboard Power View in Excel 2013 is an advanced tool designed to provide businesses with a comprehensive, interactive view of their sales performance. With this powerful Excel dashboard, you can visualize your sales data using interactive charts, tables, and slicers that offer deep insights into your business performance. This dashboard is specifically designed for Excel 2013, taking advantage of Power View features to provide a dynamic and real-time presentation of your sales data.
Whether you’re tracking sales performance by region, product, or salesperson, this Sales Dashboard Power View allows you to explore your data in an intuitive and easy-to-understand format. The interactive features, such as filters and drill-down capabilities, allow you to analyze your sales from different angles and make informed, data-driven decisions.
Key Features of the Sales Dashboard Power View in Excel 2013
📌 Interactive Dashboard with Power View
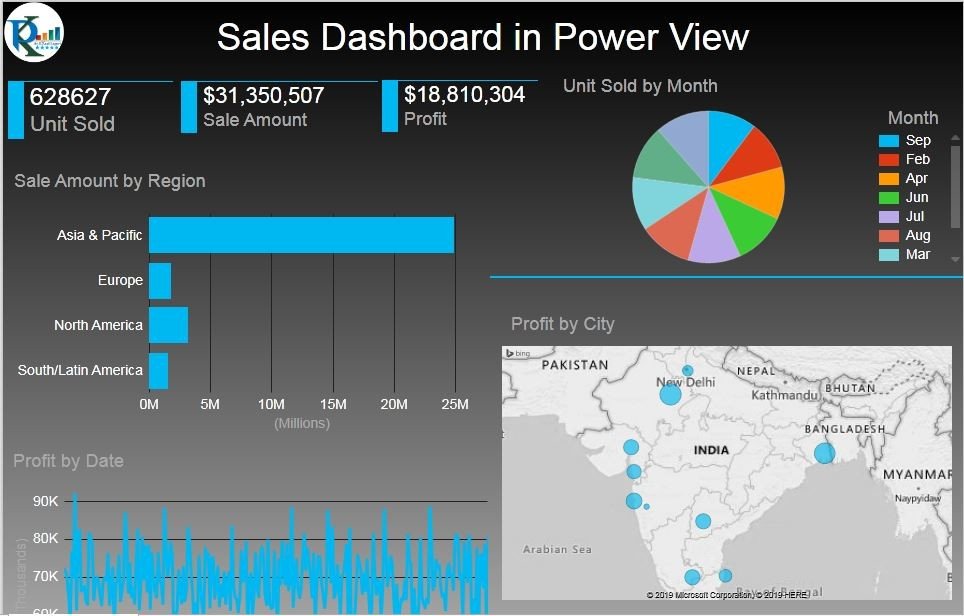
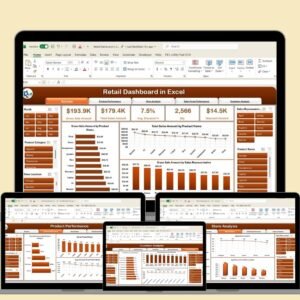
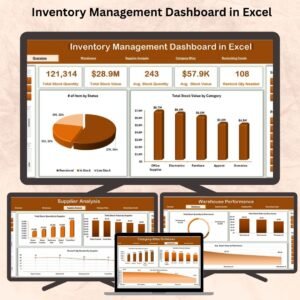
This dashboard leverages the power of Power View in Excel 2013 to create interactive charts, tables, and slicers that provide a dynamic view of your sales data. Explore your sales performance at a glance and drill down into the specifics of your data with ease.
🛠 Customizable Metrics
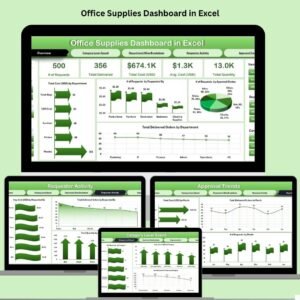
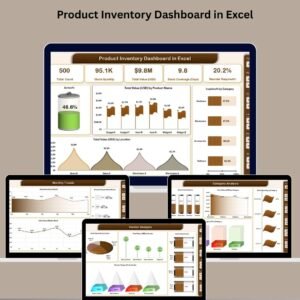
You can easily customize the dashboard to focus on the sales metrics that matter most to you. Whether it’s total sales, sales by product, by region, or by salesperson, you have the flexibility to adjust the dashboard to fit your specific needs.
💡 Real-Time Data Updates
The dashboard automatically updates in real-time as new data is entered into your Excel file, ensuring that you always have the most up-to-date sales performance data at your fingertips.
🔢 Dynamic Charts and Tables
Track and visualize sales performance with dynamic charts and tables that automatically update as your data changes. The interactive slicers allow you to filter your data by different categories, such as time period, region, or product, giving you a clear view of your sales performance.
🚀 Powerful Data Insights
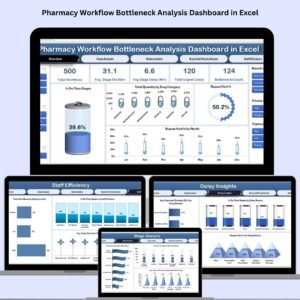
With interactive data visualizations, you can identify trends, spot underperforming products, and see which regions or salespeople are performing the best. This makes it easy to take quick action and adjust strategies as needed.
📊 User-Friendly Interface
The dashboard is designed to be user-friendly and intuitive. With just a few clicks, you can generate detailed reports, analyze trends, and uncover key insights without the need for complex Excel formulas or pivot tables.
⚙ Simple Setup and Customization
Setting up the Sales Dashboard Power View in Excel 2013 is quick and easy. With simple setup instructions and customizable options, you can get the dashboard running in no time and tailor it to your specific needs.
🚀 Why You’ll Love the Sales Dashboard Power View in Excel 2013
✅ Interactive and Dynamic – Get a dynamic view of your sales data with interactive charts and tables. ✅ Customizable Metrics – Focus on the sales metrics that matter most to you. ✅ Real-Time Data Updates – Ensure that your data is always up-to-date with automatic updates. ✅ Powerful Insights – Identify trends and performance gaps with ease. ✅ User-Friendly Interface – Generate detailed sales reports and insights with minimal effort.
📂 What’s Inside the Sales Dashboard Power View in Excel 2013?
- Interactive Power View Dashboard: An interactive dashboard for visualizing sales data.
- Customizable Sales Metrics: Focus on specific sales data like region, product, or salesperson.
- Real-Time Data Updates: Data automatically updates as you enter new information.
- Dynamic Charts and Tables: Visualize trends and performance with interactive data visualizations.
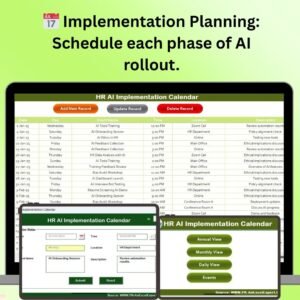
- Clear Setup Instructions: Step-by-step guide to get your dashboard up and running.
🔍 How to Use the Sales Dashboard Power View in Excel 2013
1️⃣ Download the Template – Instant access to the Excel file upon purchase. 2️⃣ Input Your Sales Data – Enter your sales data for the dashboard to visualize. 3️⃣ Customize Your Dashboard – Adjust filters, categories, and metrics to focus on your key performance indicators. 4️⃣ Analyze and Visualize – Use the interactive charts and tables to track performance and uncover trends. 5️⃣ Present and Share – Share the dynamic dashboard with stakeholders or use it in presentations.
🎯 Who Can Benefit from the Sales Dashboard Power View in Excel 2013? 🔹 Sales Managers
🔹 Business Owners
🔹 Data Analysts
🔹 Marketing Teams
🔹 Project Managers
🔹 Anyone involved in tracking and analyzing sales performance
Enhance your sales tracking and reporting with the Sales Dashboard Power View in Excel 2013. With real-time updates, interactive features, and customizable metrics, this dashboard allows you to make informed decisions and drive business growth.
Click here to read the Detailed blog post
https://www.pk-anexcelexpert.com/sales-dashboard-power-view-in-excel-2013/


Reviews
There are no reviews yet.