

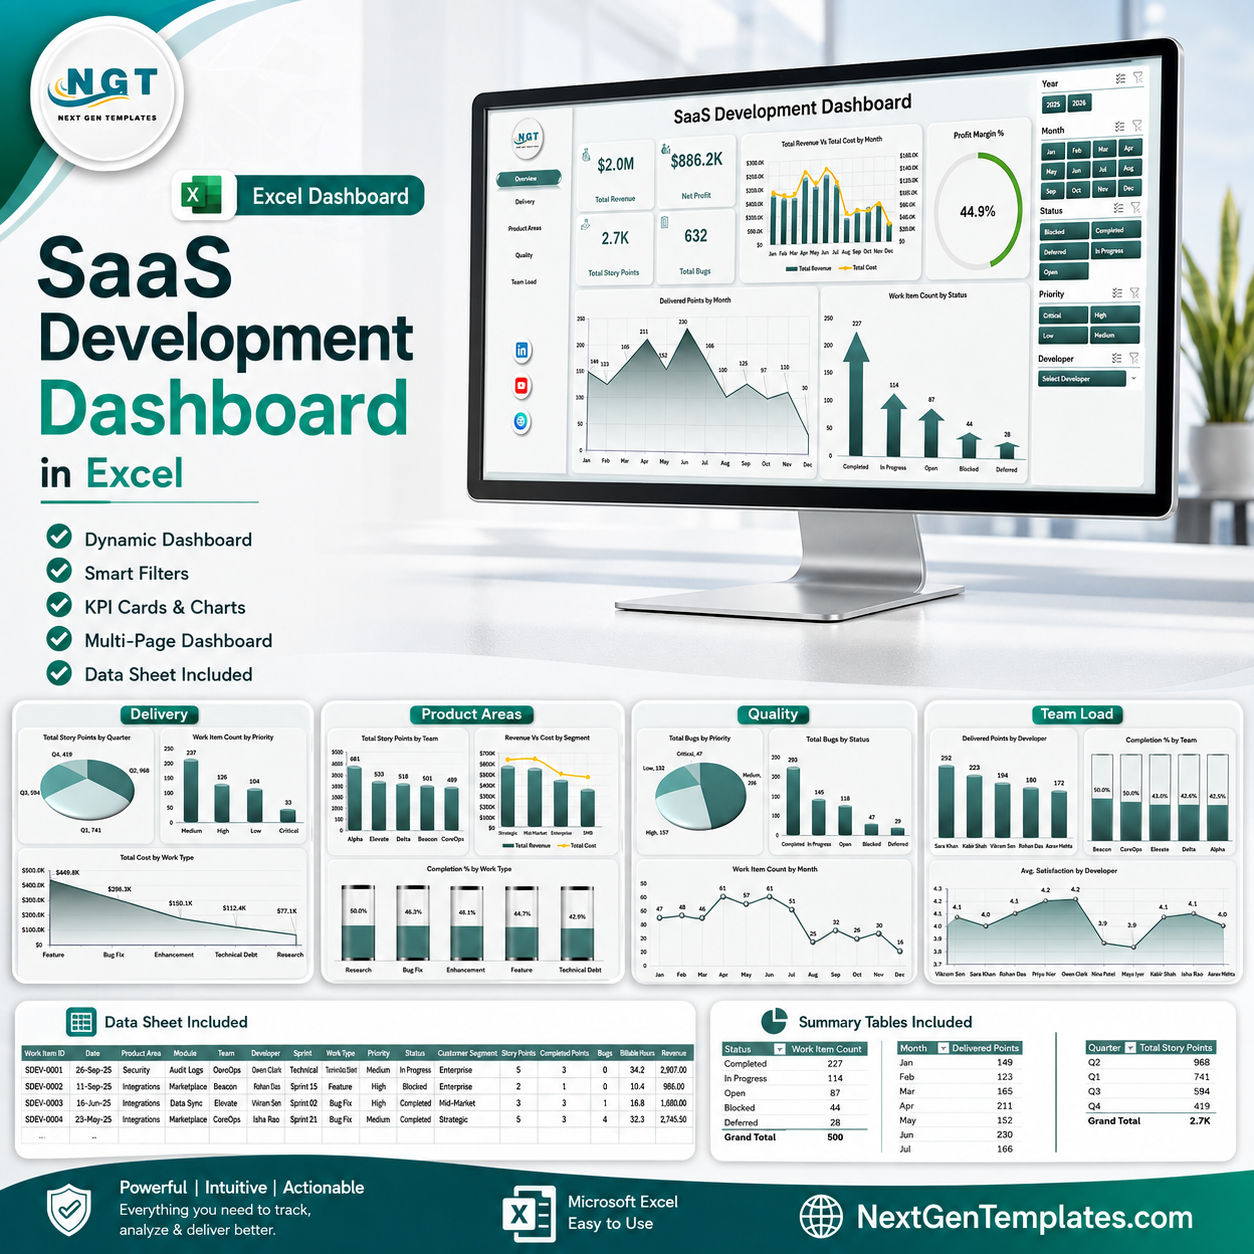



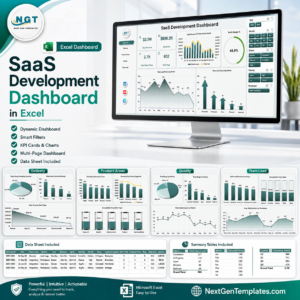
SaaS Development Dashboard in Excel gives software leaders a refreshable workbook with 7 worksheet tabs, 4 high-level KPI cards, 20 analysis charts, multiple slicers, a structured Data Sheet, and a pivot-based Support Sheet. Track Total Revenue, Net Profit, Total Story Points, Total Bugs, delivery output, product areas, work quality, team load, cost, profit margin, satisfaction, and bug trends in one editable Excel dashboard. Built by PK for a 300K+ subscriber Excel learning audience, this is a one-time $17.99 download with no recurring SaaS dashboard fee.
Key Features of SaaS Development Dashboard in Excel
- 7 worksheet tabs: Overview, Delivery, Product Areas, Quality, Team Load, Data Sheet, and Support Sheet.
- 4 KPI cards: Total Revenue, Net Profit, Total Story Points, and Total Bugs.
- 20 chart views: Analyze revenue, cost, story points, bugs, status, priority, modules, teams, developers, satisfaction, and profit margin.
- Multiple slicers: Filter the dashboard quickly across the available dashboard fields without rebuilding charts.
- Refreshable Excel model: Replace records in the Data Sheet, click Refresh All, and the pivot tables and charts update.
- Editable workbook: Customize columns, labels, charts, slicers, and pivot tables for your SaaS product reporting process.
What’s Inside the SaaS Development Dashboard in Excel
1. Overview Page
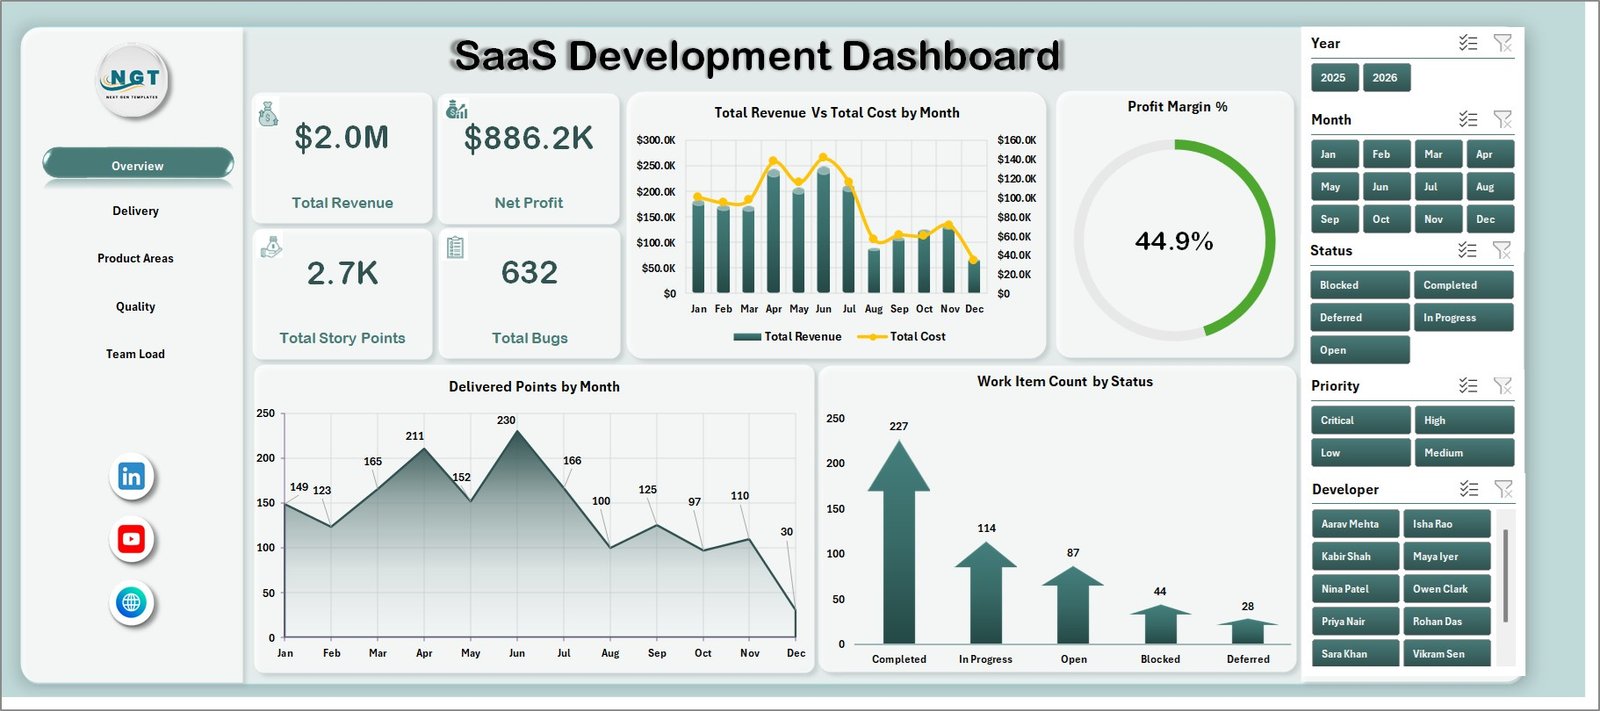
The Overview page gives founders, product managers, and delivery leads a fast executive view. The KPI cards show Total Revenue, Net Profit, Total Story Points, and Total Bugs so users can compare commercial performance with delivery throughput and quality.
Total Revenue Vs Total Cost by Month: This chart compares monthly revenue against delivery cost. It helps identify months where cost growth is reducing the benefit of higher revenue.
Profit Margin % by Overall Performance: This chart connects profit margin with overall performance labels. It helps leaders understand whether delivery outcomes are supporting healthy margins.
Delivered Points by Month: This chart tracks story point delivery by month. It helps product and engineering teams review throughput trends and sprint capacity patterns.
Work Item Count by Status: This chart separates work items by status. It helps teams quickly see open, completed, blocked, delayed, or in-progress workload patterns.
2. Delivery
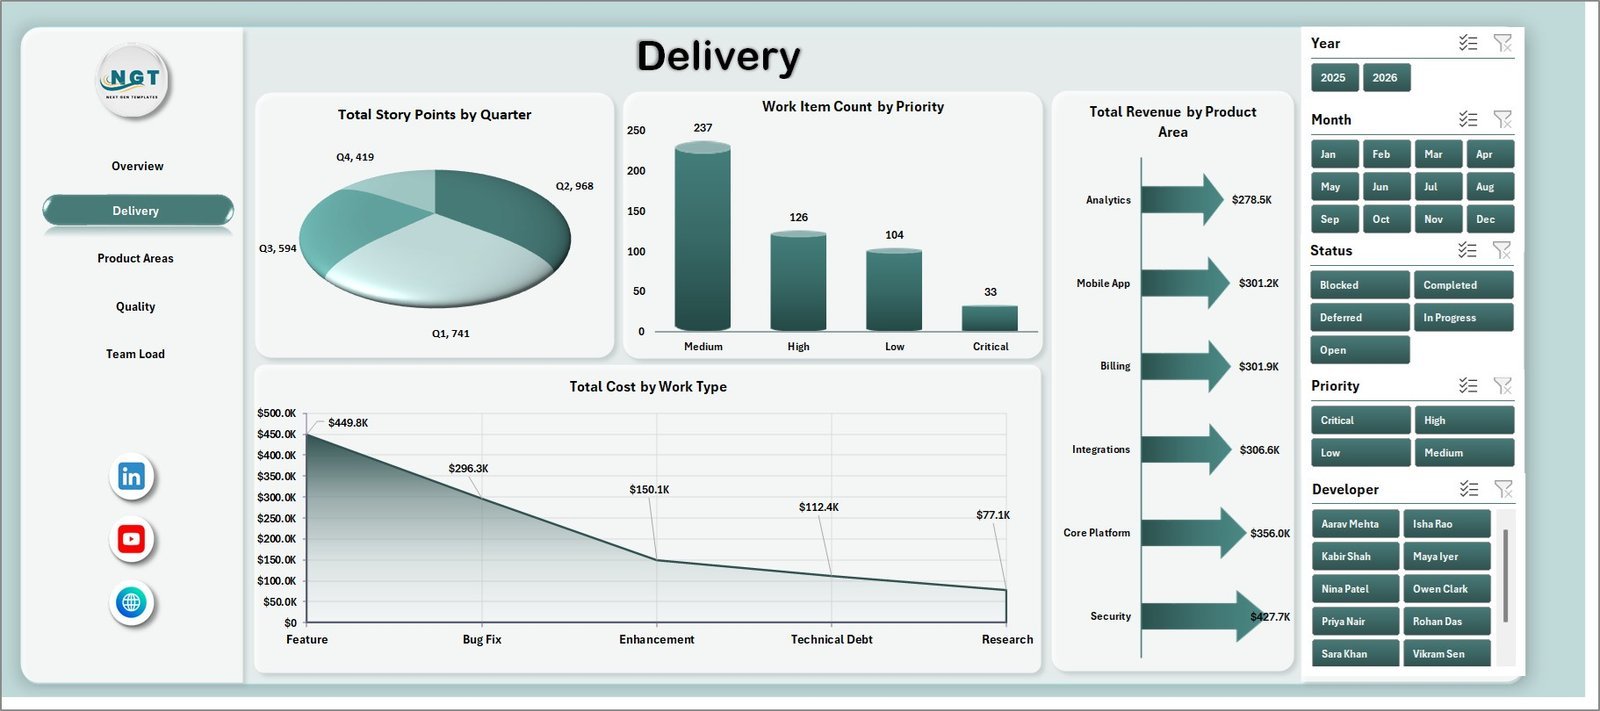
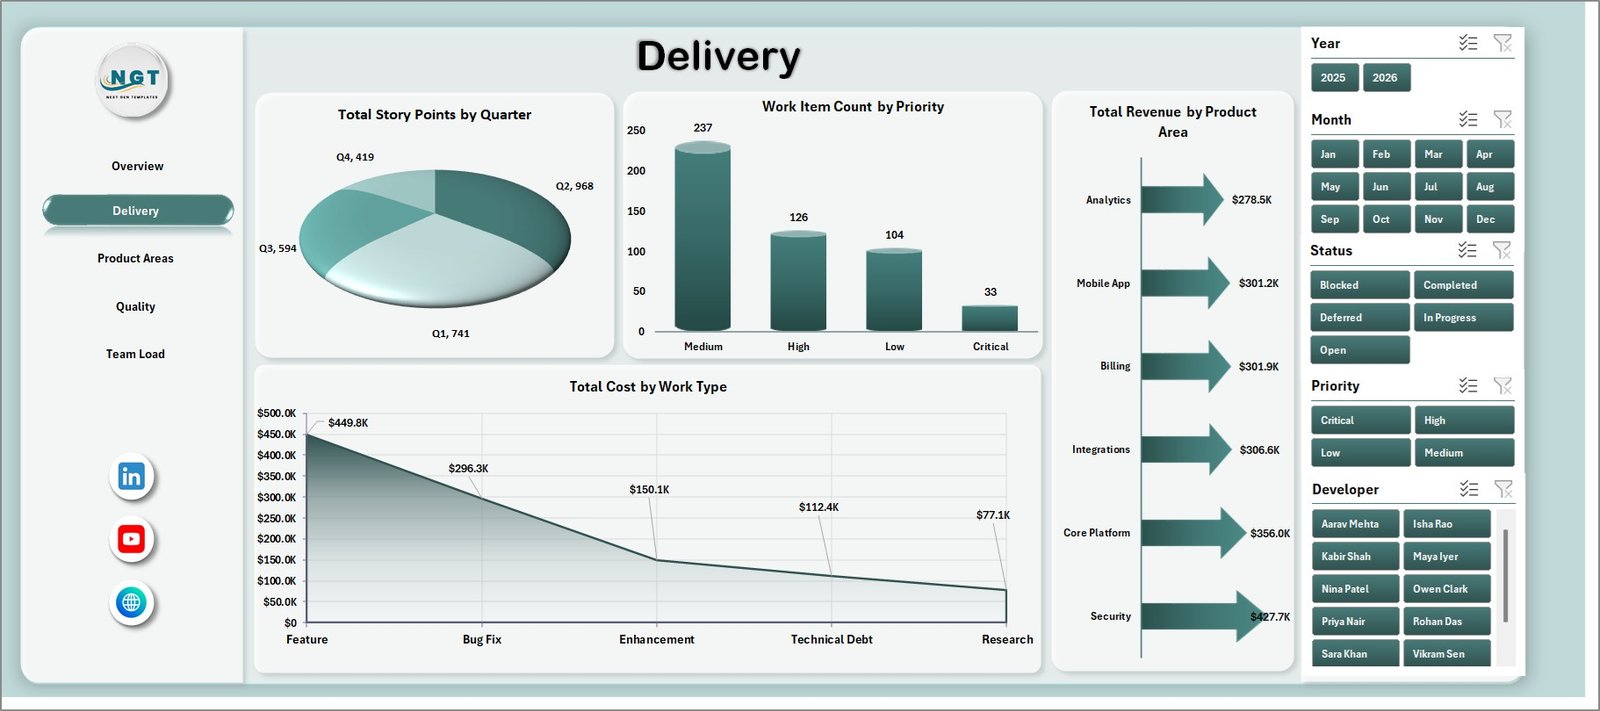
The Delivery sheet focuses on quarterly story points, priority mix, product-area revenue, and work-type cost. It is useful for sprint reviews, delivery governance, and roadmap planning.
Total Story Points by Quarter: This chart shows delivery output across quarters. It helps teams evaluate whether capacity is increasing, stable, or falling over time.
Work Item Count by Priority: This chart groups backlog items by priority. It helps managers see whether critical or high-priority work is dominating the plan.
Total Revenue by Product Area: This chart compares revenue contribution across product areas. It helps product owners identify which modules or areas are driving commercial value.
Total Cost by Work Type: This chart breaks cost by work type. It helps separate development, testing, support, bug fixing, research, or other work categories.
3. Product Areas
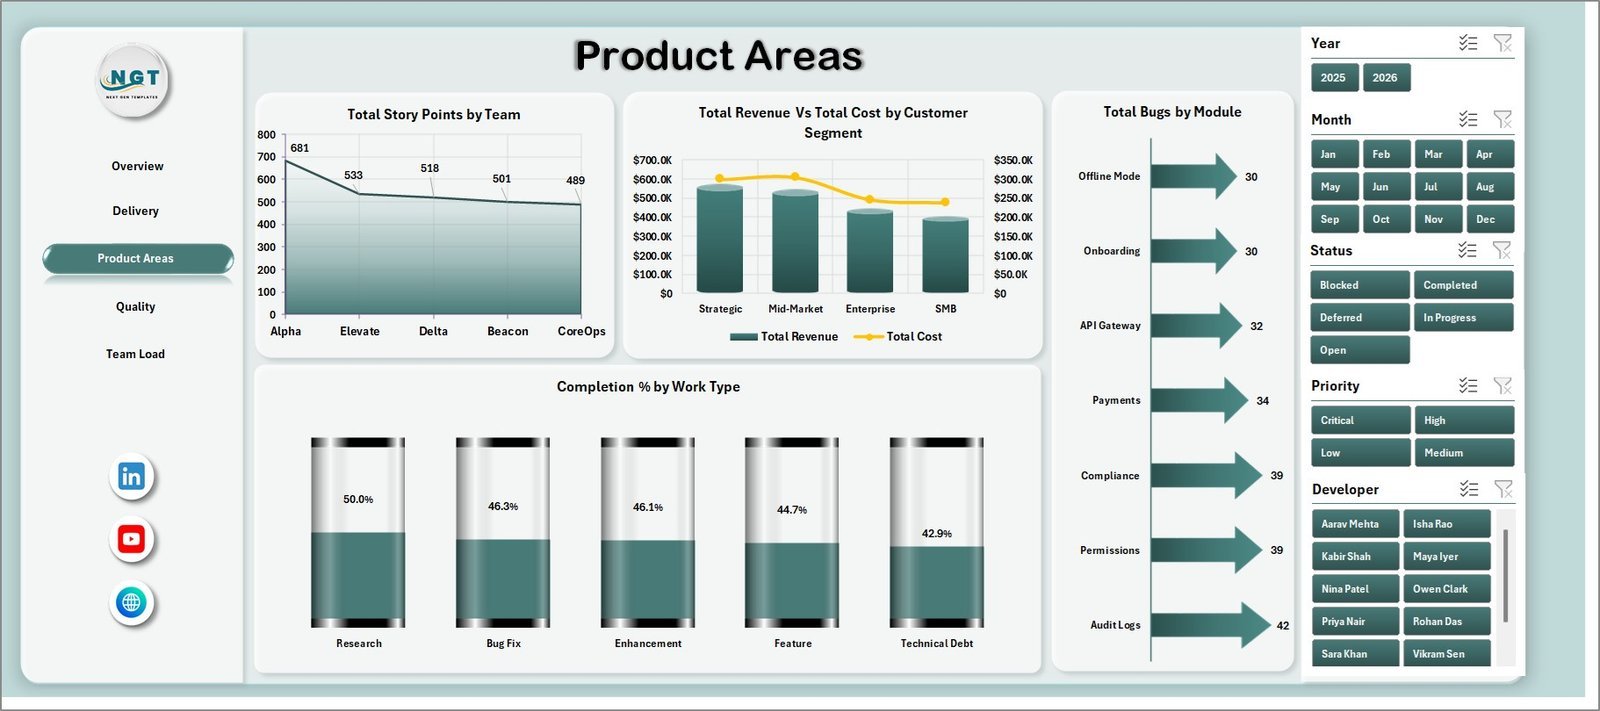
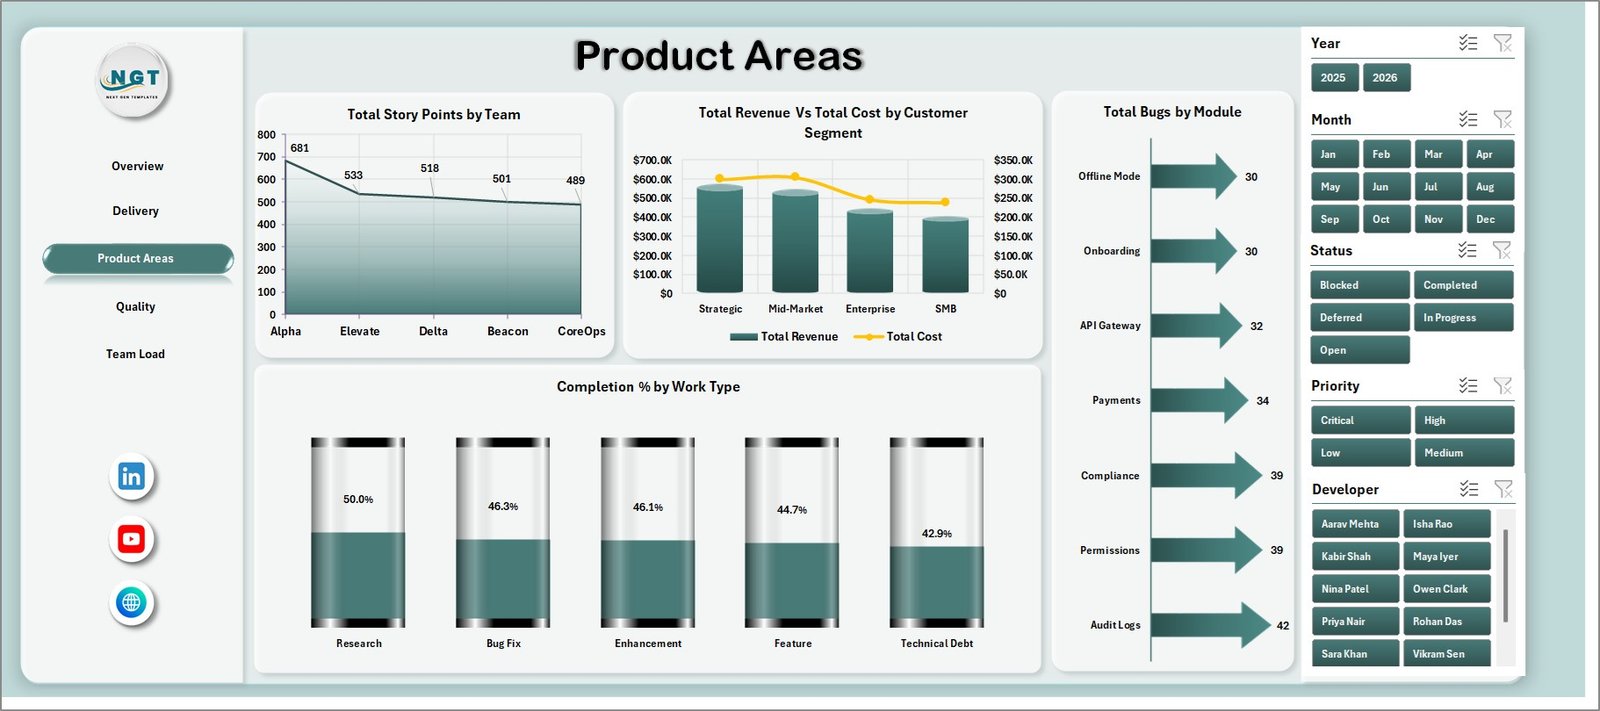
The Product Areas sheet helps users compare team output, customer segments, modules, and work-type completion. It is built for product managers who need to understand which areas are creating value and which ones need attention.
Total Story Points by Team: This chart compares delivered story points across teams. It helps managers review workload distribution and delivery contribution.
Total Revenue Vs Total Cost by Customer Segment: This chart compares revenue and cost by customer segment. It helps identify segments that may be profitable, expensive to serve, or ready for further investment.
Total Bugs by Module: This chart shows bug volume by module. It helps QA and product teams locate modules with higher defect concentration.
Completion % by Work Type: This chart compares completion percentage across work categories. It helps highlight where progress is strong and where work is lagging.
4. Quality
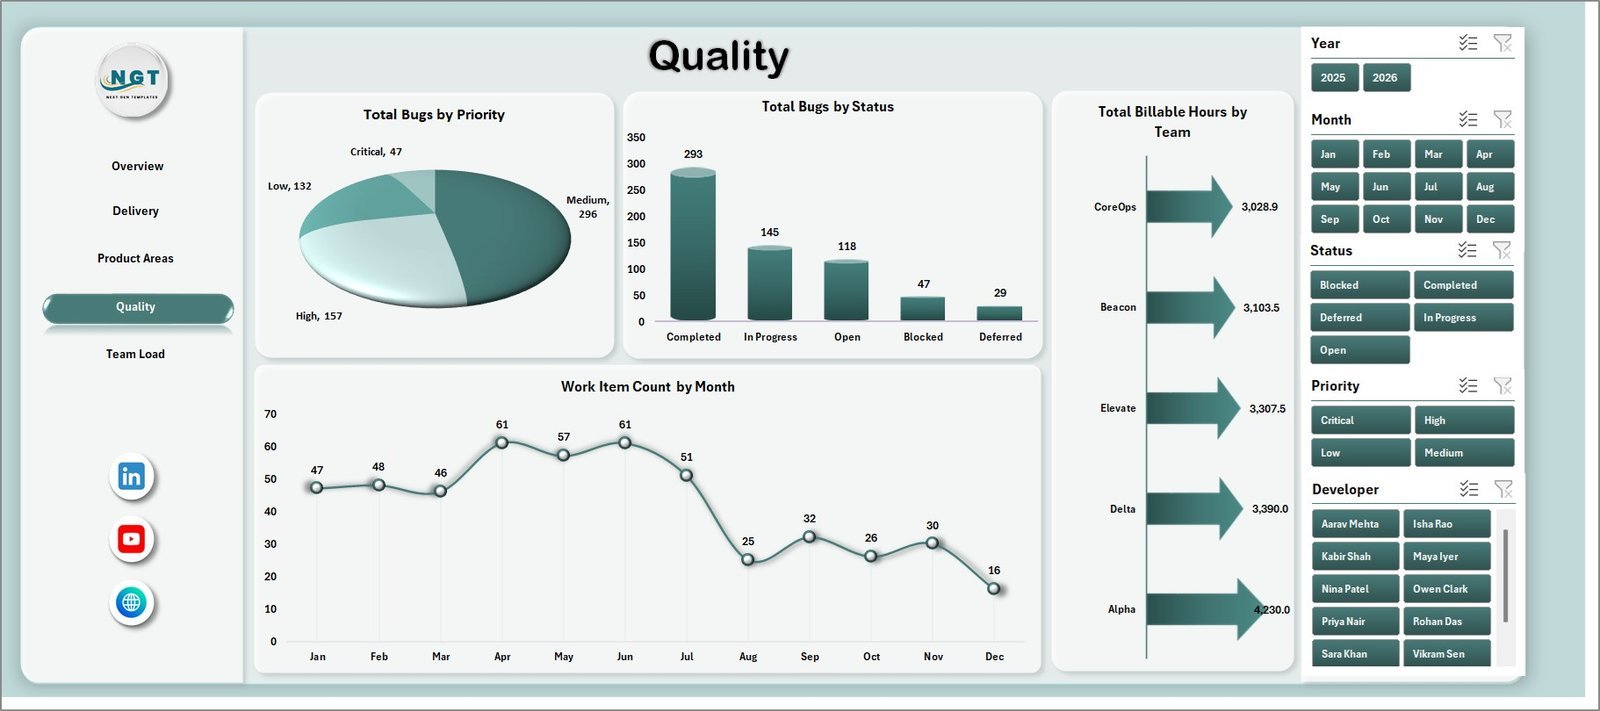
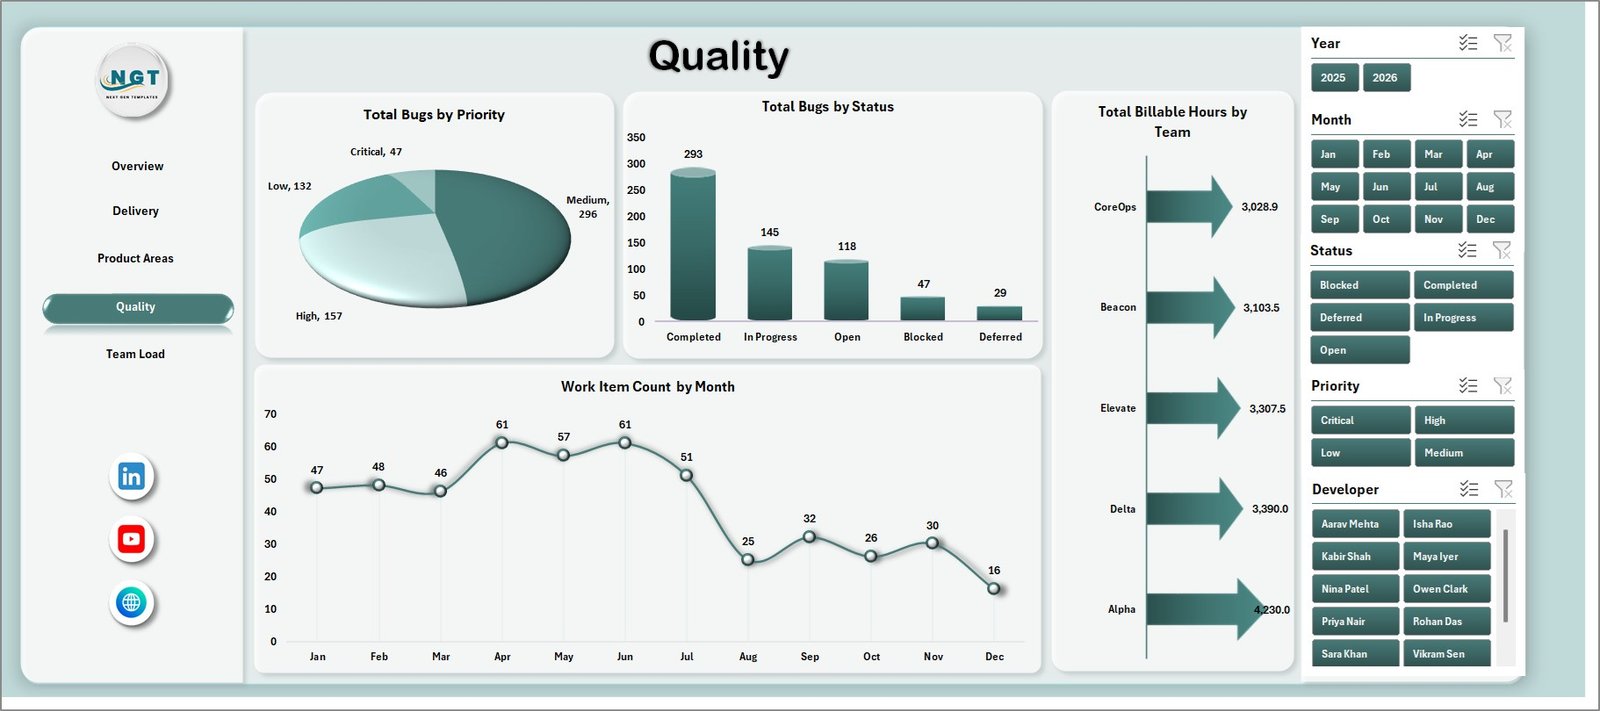
The Quality sheet focuses on bug priority, bug status, billable hours, and work item volume over time. It helps engineering and QA leaders balance speed with reliability.
Total Bugs by Priority: This chart groups bugs by severity or priority. It helps teams focus on high-impact issues before lower-priority fixes.
Total Bugs by Status: This chart shows bug counts by status. It helps identify whether issues are open, fixed, in testing, reopened, or pending action.
Total Billable Hours by Team: This chart compares billable or chargeable hours across teams. It helps review effort allocation and delivery workload.
Work Item Count by Month: This chart tracks monthly work item volume. It helps teams see demand patterns and workload spikes.
5. Team Load
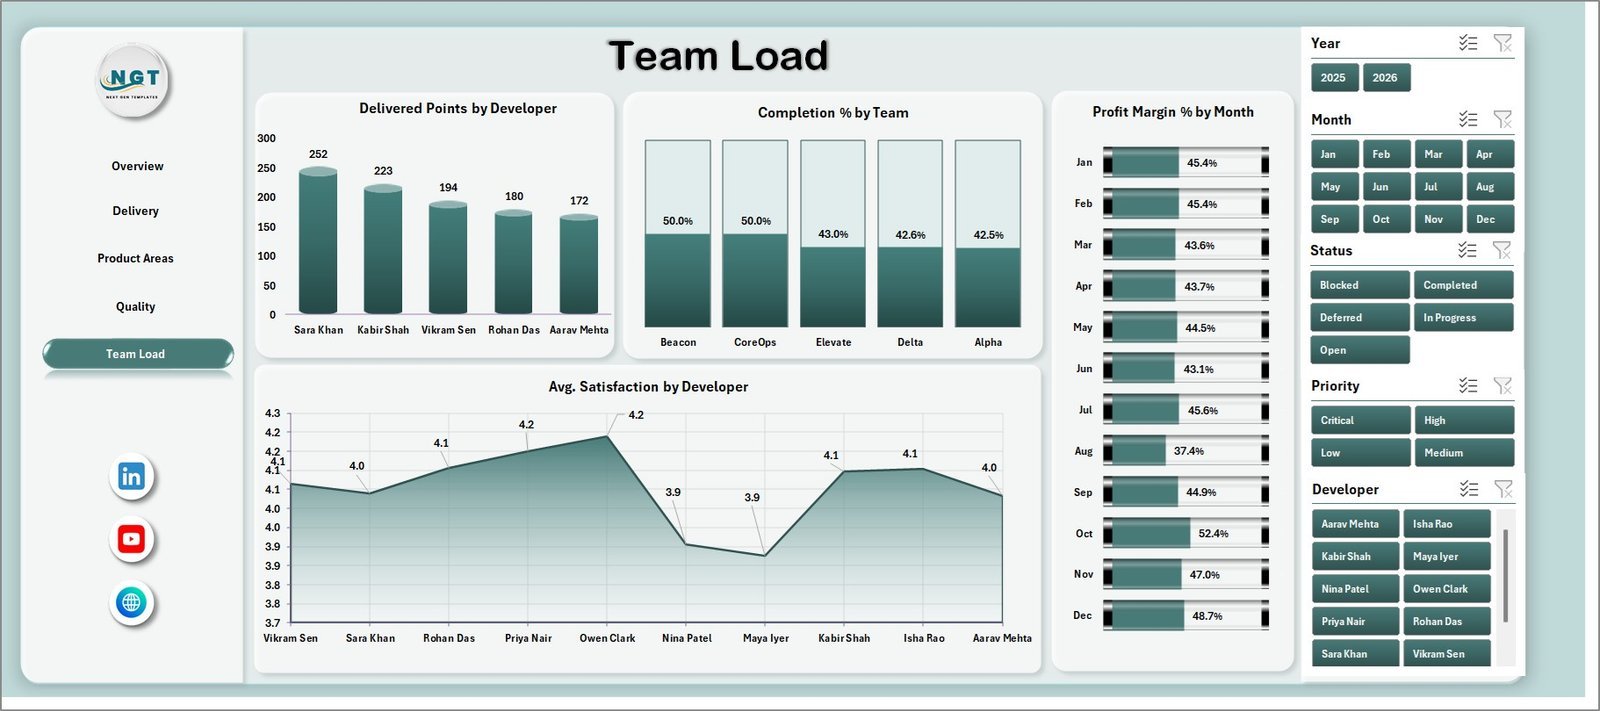
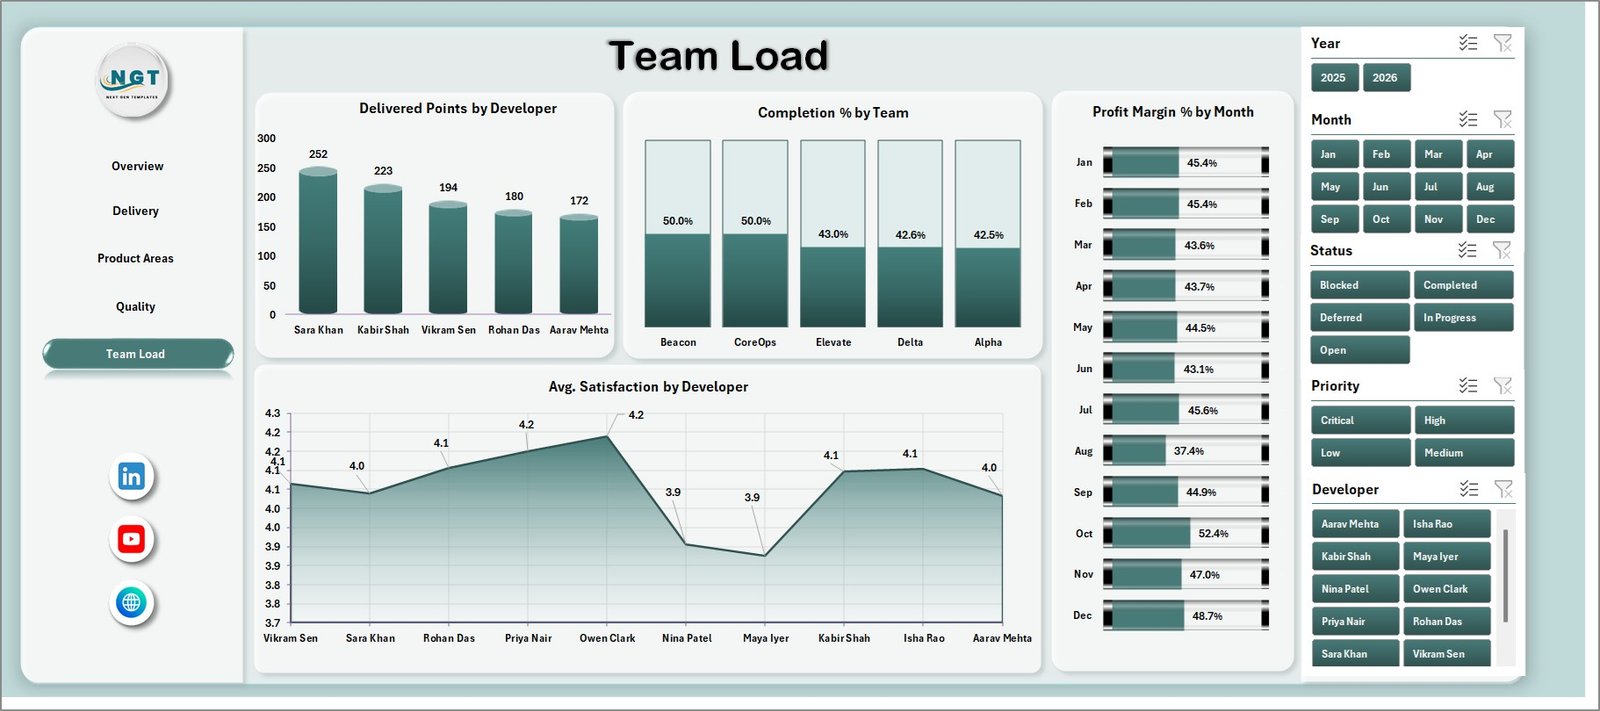
The Team Load sheet gives a people-focused view of developer output, team completion, margin movement, and satisfaction. It is useful for planning capacity and reviewing balanced delivery.
Delivered Points by Developer: This chart compares delivered points by developer. It helps leads understand individual contribution and workload spread.
Completion % by Team: This chart compares completion percentage across teams. It helps identify groups that are progressing well and groups that may need support.
Profit Margin % by Month: This chart tracks margin trend month by month. It helps connect delivery operations with business profitability.
Avg. Satisfaction by Developer: This chart compares satisfaction scores by developer. It helps managers review experience, service quality, or stakeholder feedback patterns.
6. Data Sheet Tab
The Data Sheet is where users add SaaS development records in the same format as the sample data. Keeping the structure consistent allows dashboard cards, slicers, charts, and pivot tables to refresh correctly.

7. Support Sheet
The Support Sheet contains the pivot tables used to create the dynamic dashboard. After updating the Data Sheet, go to the Data tab in the Excel Ribbon and click Refresh All. You can keep this sheet hidden during normal dashboard use.

SaaS Development Dashboard in Excel vs. Google Sheets vs. Paid CRM/SaaS – Where This Fits
| Feature | This Excel dashboard | Google Sheets alternative | Paid SaaS alternative |
|---|---|---|---|
| Cost | $17.99 one-time sale price | Low tool cost but more manual setup | Monthly or annual subscription |
| Platform | Microsoft Excel | Google Sheets | Vendor-hosted product analytics or PM tool |
| Setup time | Replace data and refresh | Build formulas, charts, and filters manually | Account setup, integrations, and onboarding |
| Real-time collaboration | Best through Microsoft 365 sharing | Strong browser collaboration | Usually included by paid seat |
| Customizable fields | Editable workbook, pivots, charts, and source table | Editable but easier to break | Limited by vendor settings |
| Year-1 cost at 5 users | $17.99 plus Excel access | Workspace access plus build time | Often hundreds or thousands of dollars |
| SaaS delivery fit | Best for refreshable monthly reporting | Best for shared lightweight tracking | Best for live workflow and app integrations |
Who This Template Is For – and Who It’s Not For
This template is for SaaS founders, product managers, engineering managers, scrum masters, delivery leads, QA managers, startup finance analysts, and consultants who need repeatable Excel reporting for revenue, cost, story points, bugs, modules, teams, developers, and customer segments.
It is not a replacement for Jira, Azure DevOps, Linear, GitHub Projects, product analytics platforms, billing systems, or live SaaS monitoring tools. Use it as a management reporting layer when your development and commercial data can be exported or entered into Excel.
How to Use the SaaS Development Dashboard in Excel
- Download and unzip the product package.
- Open the workbook in Microsoft Excel.
- Review the sample records in the Data Sheet.
- Replace sample rows with your own SaaS development data in the same format.
- Go to the Excel Data ribbon and click Refresh All.
- Use slicers to filter the Overview, Delivery, Product Areas, Quality, and Team Load pages.
- Hide the Support Sheet before sharing the workbook with dashboard viewers.
Real-World Use Cases
Anika, SaaS founder: reviews monthly revenue, cost, profit margin, story points, and bug volume before investor and leadership updates.
Rohit, product delivery lead: compares work items by priority, delivered points by team, completion by work type, and customer segment cost to plan the next sprint cycle.
Meera, QA manager: uses the Quality and Product Areas sheets to identify modules with higher bug counts and teams needing additional testing focus.
Frequently Asked Questions
What is included in the SaaS Development Dashboard in Excel?
The workbook includes Overview, Delivery, Product Areas, Quality, Team Load, Data Sheet, and Support Sheet tabs with KPI cards, slicers, charts, source data, and pivot tables.
Can I use my own SaaS data?
Yes. Replace the sample rows in the Data Sheet with your own records in the same format, then refresh the workbook.
Does this dashboard require macros?
No. It is designed around Excel tables, pivot tables, slicers, cards, and charts.
Can I customize the charts and fields?
Yes. You can edit labels, chart formats, source columns, slicers, and pivot tables if you are comfortable with Excel.
Is this a live product management system?
No. It is a reporting dashboard for analysis after data is entered or exported. It does not replace Jira, Azure DevOps, Linear, or GitHub Projects.
Which Excel version should I use?
Use a modern desktop version of Microsoft Excel for the best pivot refresh and slicer experience.
About the Author
Built by PK – Microsoft Certified Professional with 15+ years of Excel, Google Sheets, and Power BI experience. Founder of NextGenTemplates, reaching 300K+ subscribers across YouTube channels. Every template is hand-built and tested before release.
Explore Related Templates
- SaaS Development KPI Dashboard in Excel
- SaaS Development KPI Dashboard in Power BI
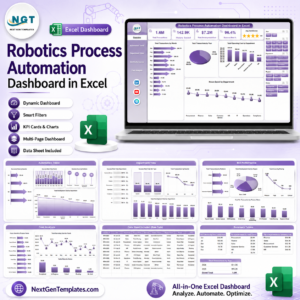
- Robotics Process Automation Dashboard in Excel
- Software Release and Deployment Calendar in Excel
- MS Excel templates
- Excel dashboard templates
Download the SaaS Development Dashboard in Excel to turn revenue, cost, story points, bugs, product areas, teams, developers, and satisfaction data into a refreshable software delivery dashboard.
Last updated: August 8, 2026.
Watch the demo video:
Compatibility and Requirements
- Works in Microsoft Excel desktop (Excel 2016 or later, or Microsoft 365).
- The dashboard uses slicers to filter the pages. Microsoft explains them in Use slicers to filter data.













Reviews
There are no reviews yet.