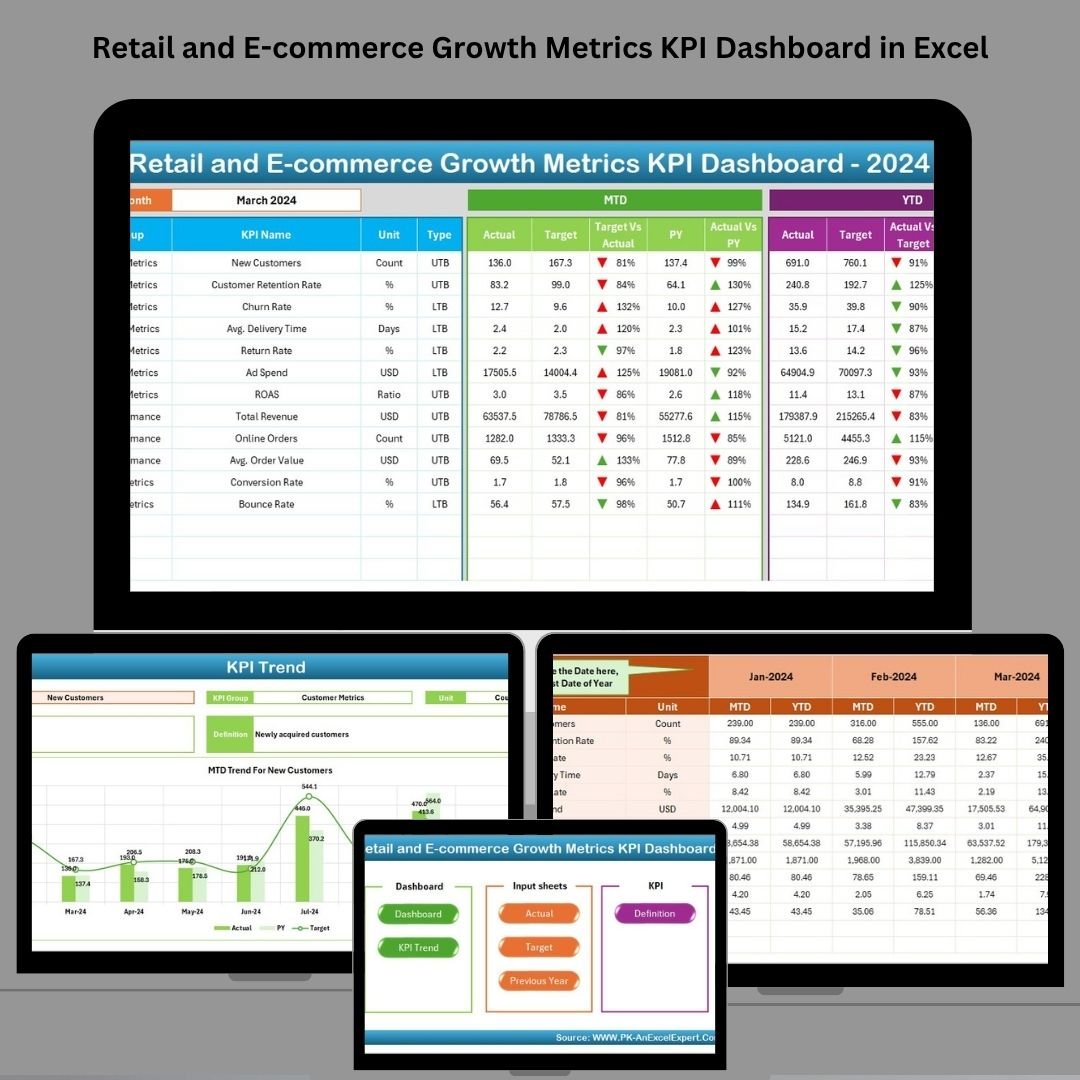

Success in retail and e-commerce hinges on real-time insights and fast decision-making. That’s exactly what the Retail and E-commerce Growth Metrics KPI Dashboard in Excel delivers—a plug-and-play analytics tool that gives you a 360° view of your business performance. 🧾📈
This Excel-based dashboard helps you track vital KPIs like revenue growth, conversion rate, customer acquisition cost, and inventory turnover—all from one centralized, easy-to-use file. Whether you’re a store owner, analyst, or manager, this tool equips you to analyze, optimize, and scale your operations efficiently.
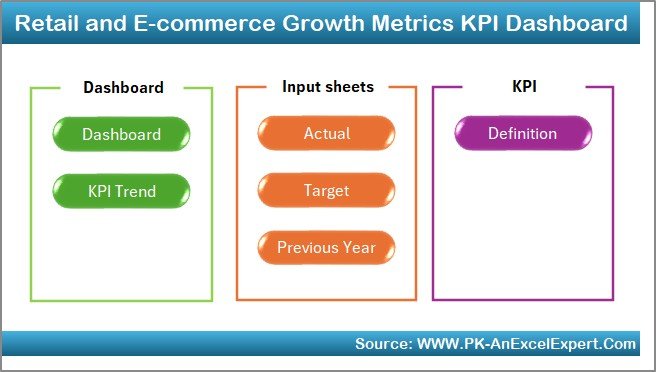
🔧 Key Features of the KPI Dashboard
🏠 Home Sheet – Central Command
Navigate the entire dashboard with ease using button-based shortcuts to all seven worksheet tabs.
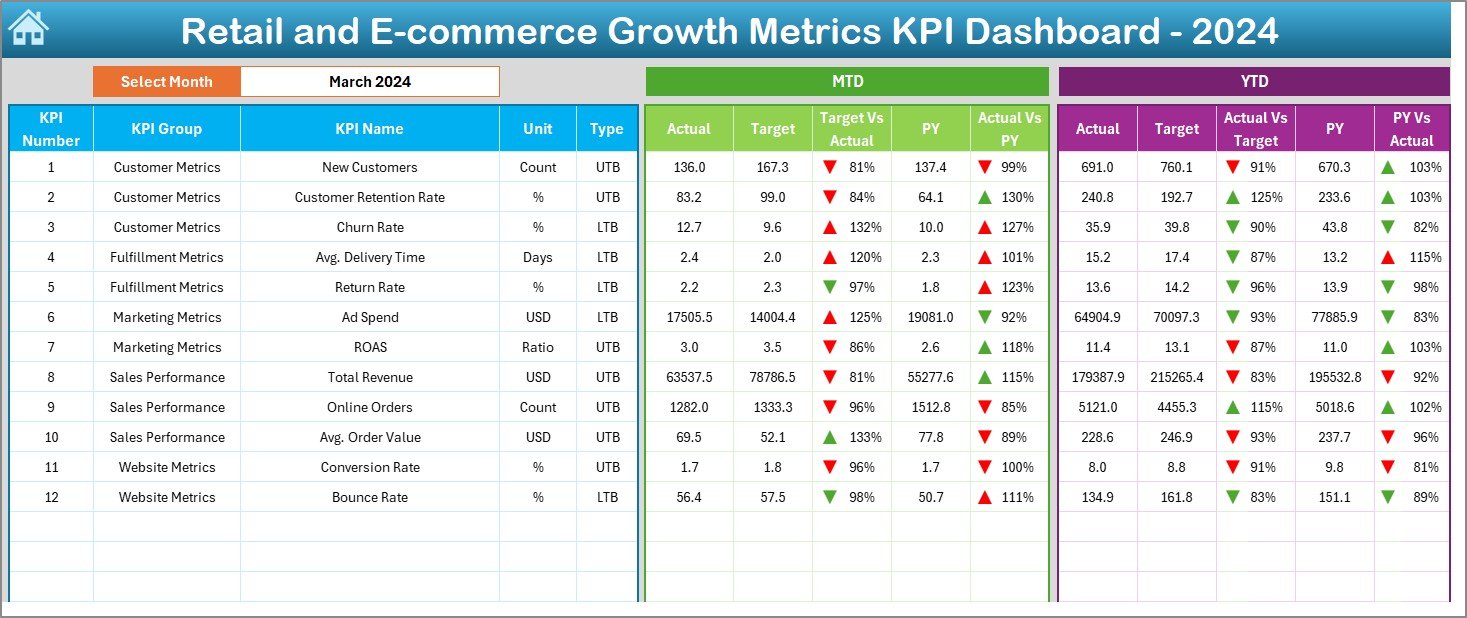
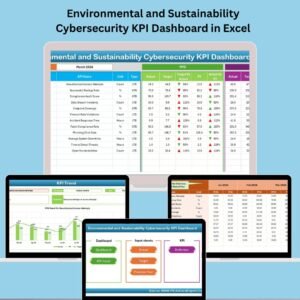
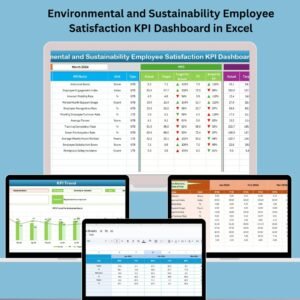
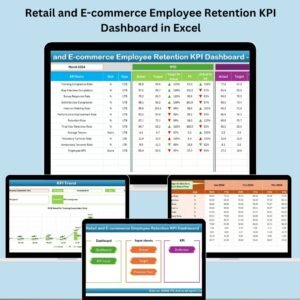
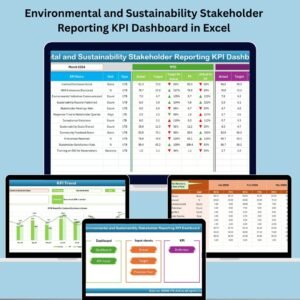
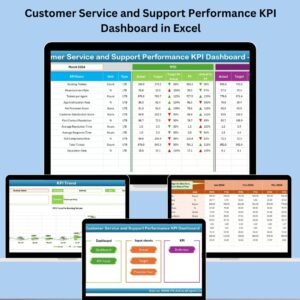
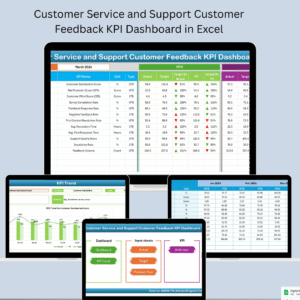
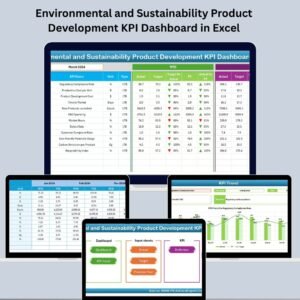
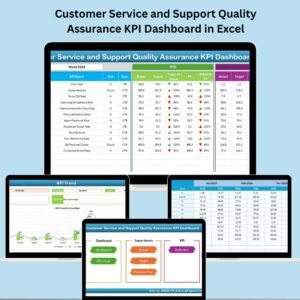
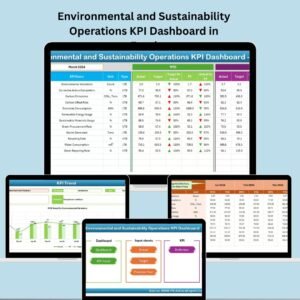
📊 Dashboard Sheet – MTD & YTD Metrics in One View
-
Drop-down selector for month (cell D3)
-
Visual charts with Actual vs Target
-
Compare with Previous Year (PY) figures
-
Conditional formatting for quick up/down visual cues
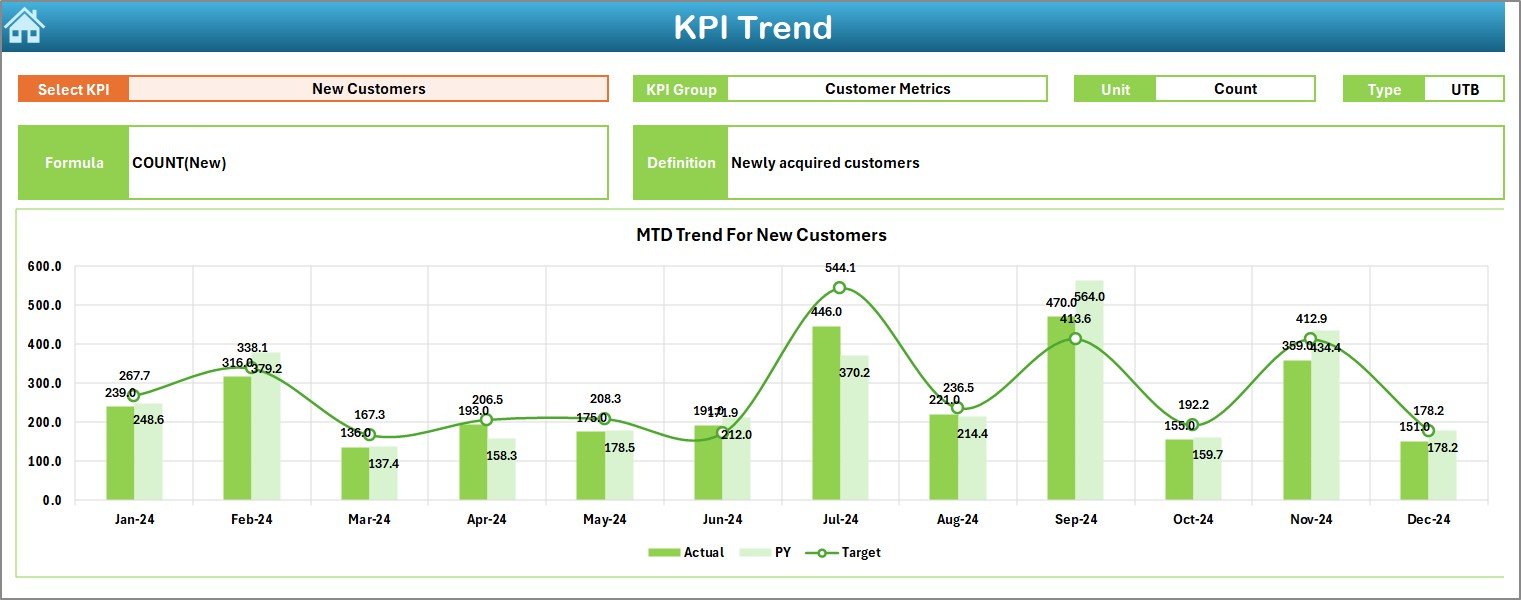
📈 KPI Trend Sheet – Pattern Detection Made Easy
-
Select any KPI from a drop-down
-
See detailed charts for Month-to-Date and Year-to-Date trends
-
Auto-pulls definitions and formulas from the KPI list
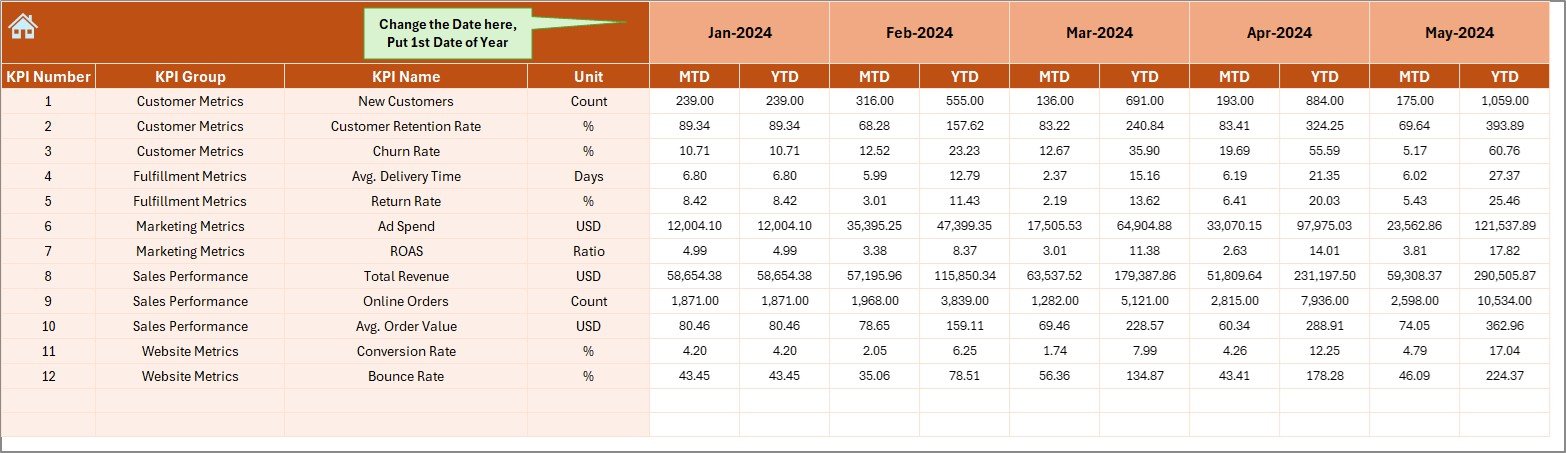
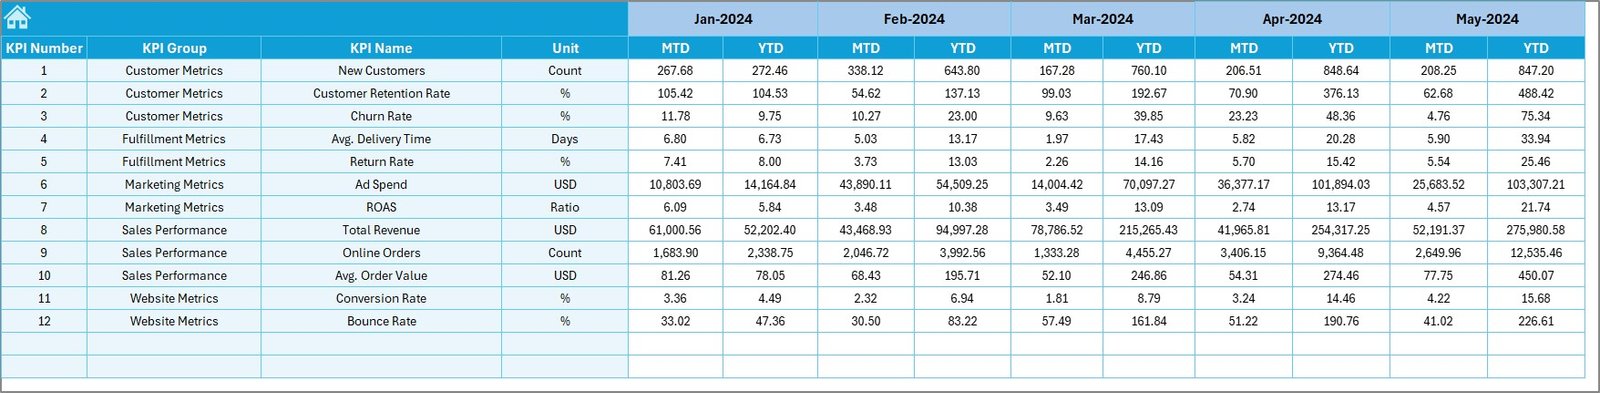
📥 Actual Numbers Input Sheet
-
Enter monthly actual data for all KPIs
-
Set your fiscal year start month (cell E1)
-
Ensures up-to-date reporting
🎯 Target Sheet
-
Set your MTD and YTD goals
-
Adjust targets at any time with easy inputs
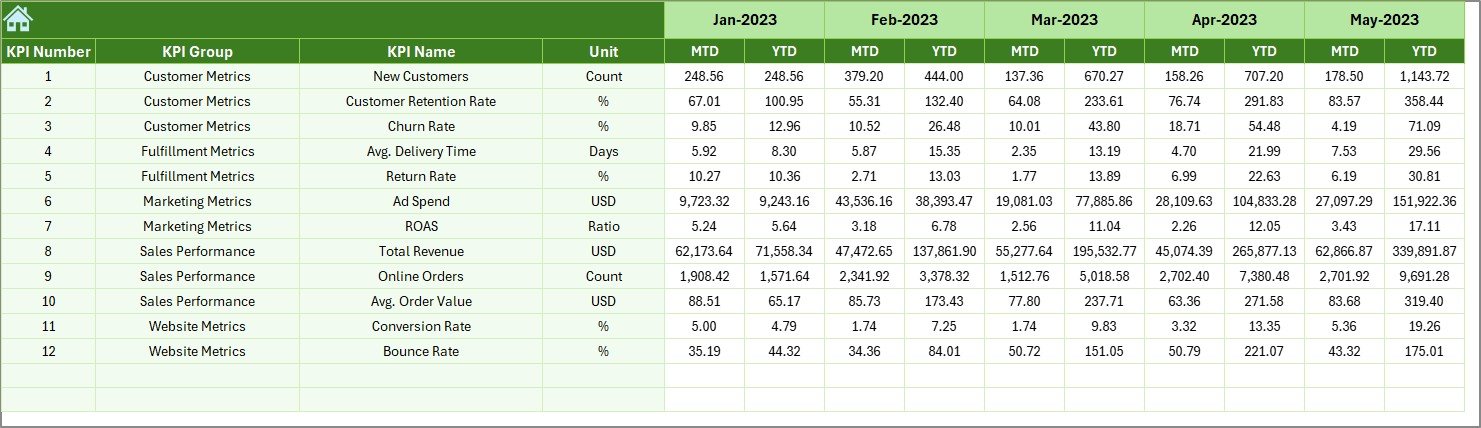
📆 Previous Year Numbers Sheet
-
Add past MTD and YTD values for comparative analysis
-
Spot growth trends and seasonal dips
📚 KPI Definition Sheet
-
Reference for all KPI formulas, units, and descriptions
-
Ensures transparency and team alignment
📂 What’s Inside the Dashboard?
✅ Pre-built Excel file with 7 interlinked tabs
✅ Drop-down filters for KPI and Month selection
✅ Conditional formatting with performance arrows
✅ Dynamic charts for MTD & YTD comparisons
✅ Data input sheets for Actuals, Targets, and Previous Year
✅ Custom KPI documentation sheet
✅ Navigation-friendly design—no Excel expertise needed!
🛠️ How to Use the Dashboard (Step-by-Step)
1️⃣ Start from the Home Sheet – Use buttons to jump to key tabs
2️⃣ Input Monthly Data – Fill in Actuals, Targets, and PY values
3️⃣ View the Dashboard Sheet – Select a month and view performance metrics
4️⃣ Analyze Trends – Use the KPI Trend tab to identify performance shifts
5️⃣ Reference Definitions – Always stay aligned using the KPI Definition tab
6️⃣ Customize – Add or remove KPIs, change charts, or update formulas as needed
👥 Who Can Benefit from This Dashboard?
This tool is perfect for:
🛍️ Online Retailers – Monitor web conversions, AOV, and abandoned carts
🏬 Physical Stores – Track departmental sales and return rates
📦 Inventory Managers – Watch turnover and stock efficiency
📣 Marketing Teams – Evaluate CAC and retention performance
📊 Analysts & Business Owners – Make smart, data-driven decisions
✅ Click here to read the Detailed blog post
🔗 Visit our YouTube channel to learn step-by-step video tutorials


Reviews
There are no reviews yet.