Looking to strengthen your retail or e-commerce cybersecurity game? 🛡️ You need more than just firewalls and passwords—you need real-time performance visibility! Introducing the Retail and E-commerce Cybersecurity KPI Dashboard in Excel—a game-changing tool to track, analyze, and improve your cybersecurity posture using just Excel. 💡
🧩 Key Features of Retail and E-commerce Cybersecurity KPI Dashboard in Excel
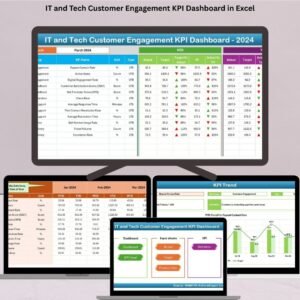
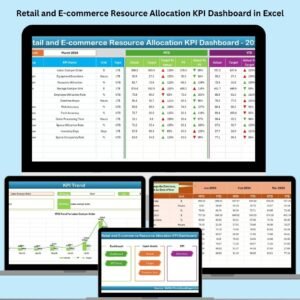
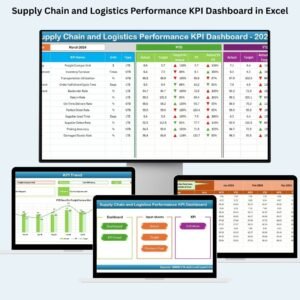
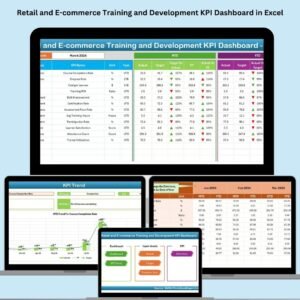
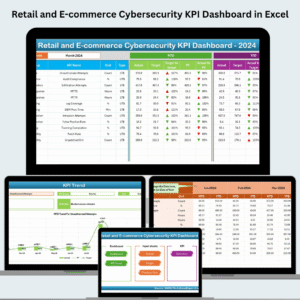
📊 All-in-One Dashboard
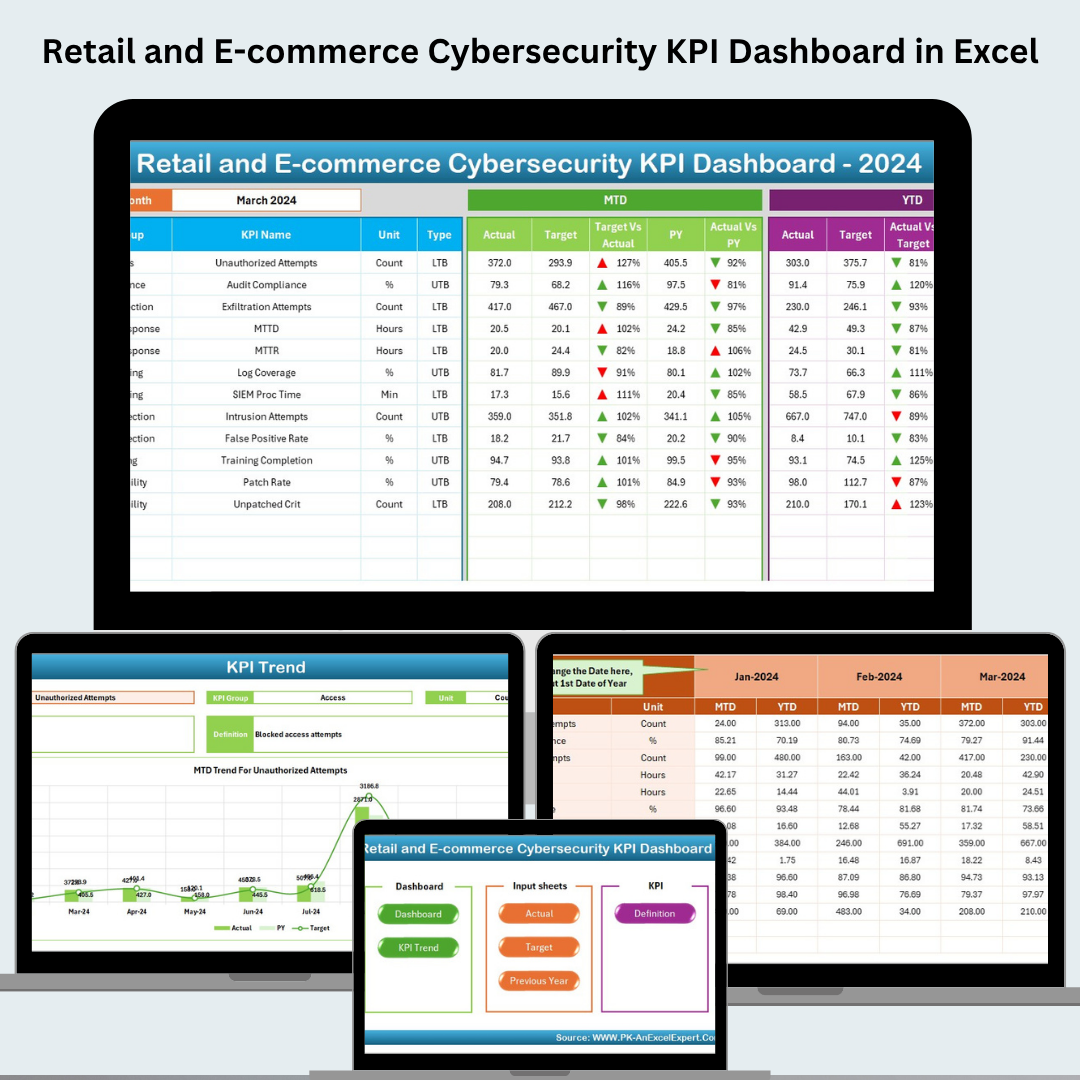
Centralizes all MTD & YTD cybersecurity KPIs like Incident Response Time, Phishing Attempts Blocked, and Vulnerabilities Remediated.
🎯 Target vs. Actual Analysis
Instantly visualize how your team is performing with up/down arrows and colored indicators based on conditional formatting.
📈 KPI Trend Tracking
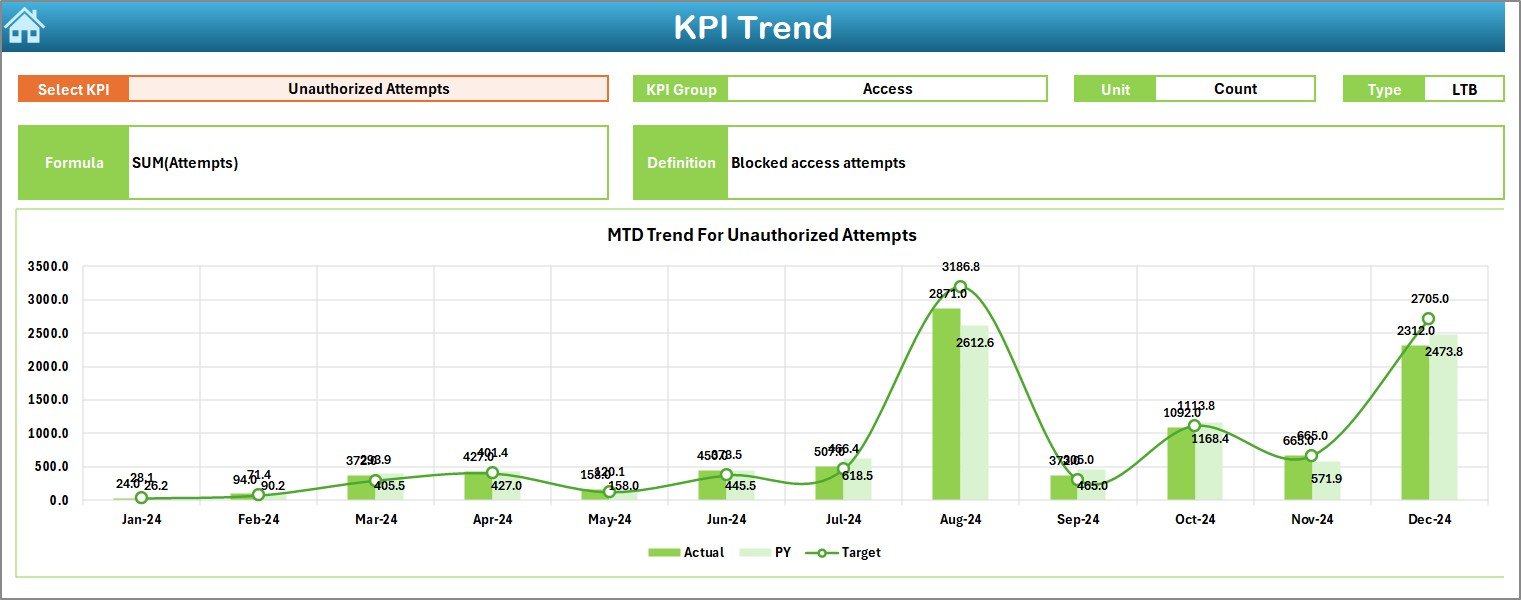
Track security metrics over time using powerful line charts that compare Actual, Target, and Previous Year (PY) data.
🧮 KPI Definition Control
Customize your KPIs by editing formulas, definitions, and performance thresholds. Tailor every metric to your organization’s needs.
📋 Raw Data Input Sheets
Dedicated tabs for Actual, Target, and PY values ensure structured data entry and allow for auto-updating dashboards.
🏠 Home Navigation Panel
Quickly jump between sheets with button-based navigation—no scrolling or confusion.
🔄 Fully Customizable
Change KPIs, charts, formatting, and logic—no coding needed. It’s all Excel.
📂 What’s Inside the Cybersecurity KPI Dashboard
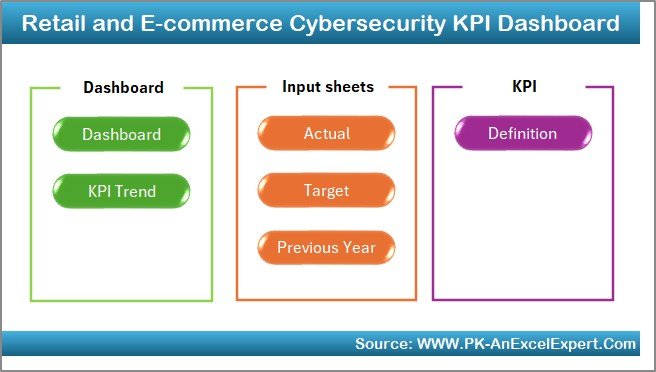
This dashboard includes 7 interconnected worksheets:
-
Home Sheet: Button-based navigation across all tabs.
-
Dashboard Sheet: Select month ➜ View all MTD/YTD KPIs with variances.
-
KPI Trend Sheet: Zoom into any KPI’s performance over time.
-
Actual Numbers Input: Enter real performance data.
-
Target Sheet: Set monthly goals and track YTD benchmarks.
-
Previous Year Sheet: Compare against last year to find seasonal trends.
-
KPI Definition Sheet: Control the logic, units, and descriptions of all KPIs.
You’ll get a fully formatted Excel file, ready to use from day one! ⚙️📥
🧭 How to Use the Cybersecurity Dashboard
1️⃣ Set Up KPI Definitions
Open the KPI Definition Sheet and define your security indicators (e.g., Patch Rate %, Breach Incidents).
2️⃣ Input Targets & Actuals
Use the Target and Actual sheets to log real-time and projected figures for each KPI.
3️⃣ Select Month for Analysis
Use the Dashboard sheet’s drop-down menu to toggle between months. View automatic updates and arrow indicators.
4️⃣ Drill Into Trends
Go to the KPI Trend Sheet to study month-over-month progress or declines.
5️⃣ Collaborate Across Teams
Share the Excel file via OneDrive/SharePoint or export reports in PDF/image formats.
👥 Who Can Benefit from This Cybersecurity Dashboard?
💼 Cybersecurity Managers — Monitor threats & performance in one glance
📊 IT Analysts — Dive deep into breach metrics, patch compliance & trend patterns
🏢 Executives & Compliance Officers — Access audit-friendly visuals and benchmark insights
🛒 E-commerce Operations Teams — Align IT goals with digital commerce risk
🛠️ MSPs or Agencies — Offer clients detailed security analytics without coding a single dashboard!
✅ Click here to read the Detailed blog post
👉 [Detailed Blog Post Link Placeholder]
🎥 Visit our YouTube channel to learn step-by-step video tutorials
🔗 PKAnExcelExpert YouTube Channel












Reviews
There are no reviews yet.