

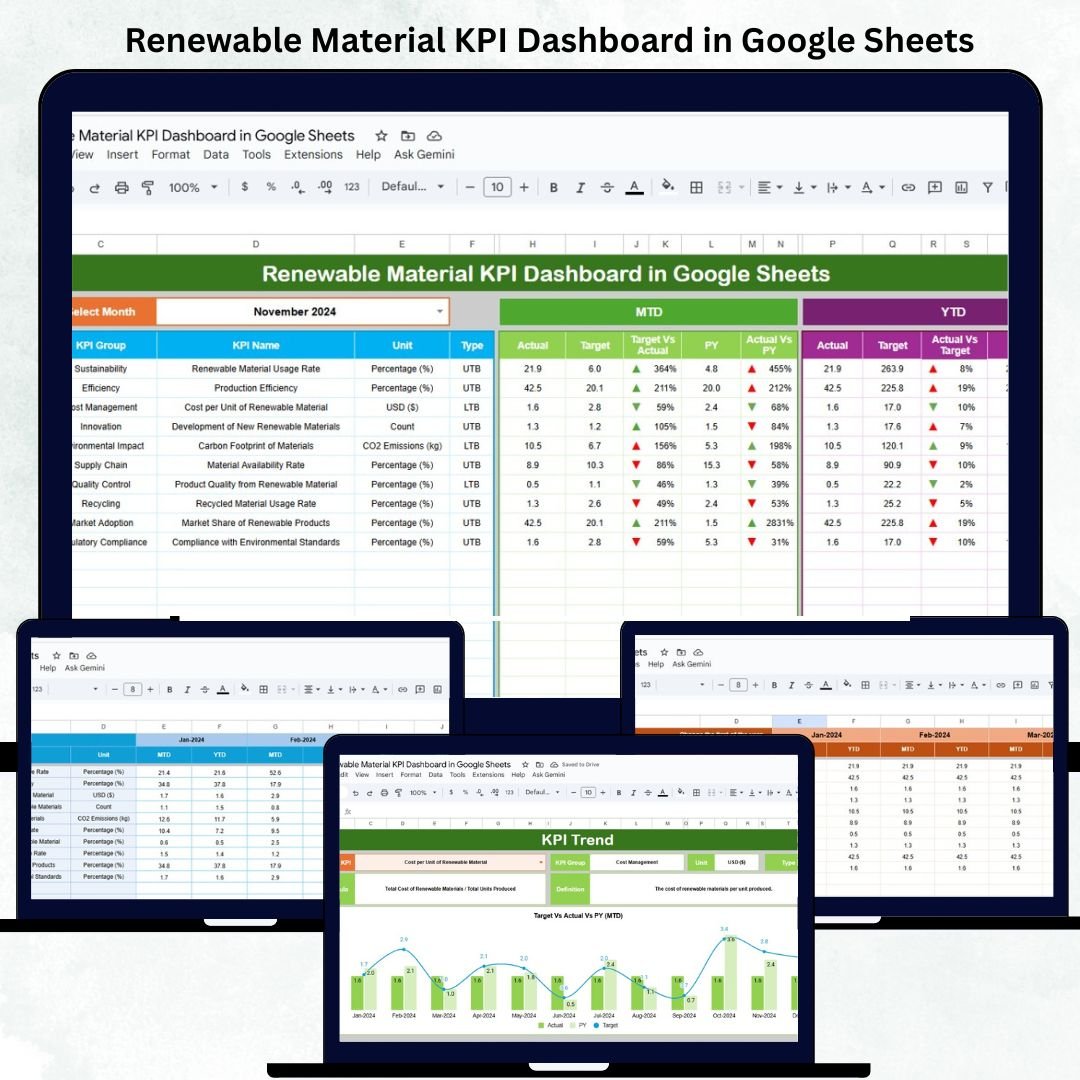
As the world transitions toward sustainability, organizations must measure their renewable material performance with accuracy and accountability. The Renewable Material KPI Dashboard in Google Sheets provides a powerful, data-driven solution to monitor renewable sourcing, waste reduction, energy usage, and cost efficiency — all in one automated and interactive file.
This ready-to-use Google Sheets dashboard enables sustainability teams, procurement managers, and environmental analysts to visualize progress, benchmark performance, and align with global sustainability goals. With automated MTD/YTD metrics and color-coded visualizations, it offers transparency, precision, and real-time decision support without complex tools or coding.
🔑 Key Features of the Renewable Material KPI Dashboard in Google Sheets
📊 Dashboard Sheet Tab (Main Visualization Page)
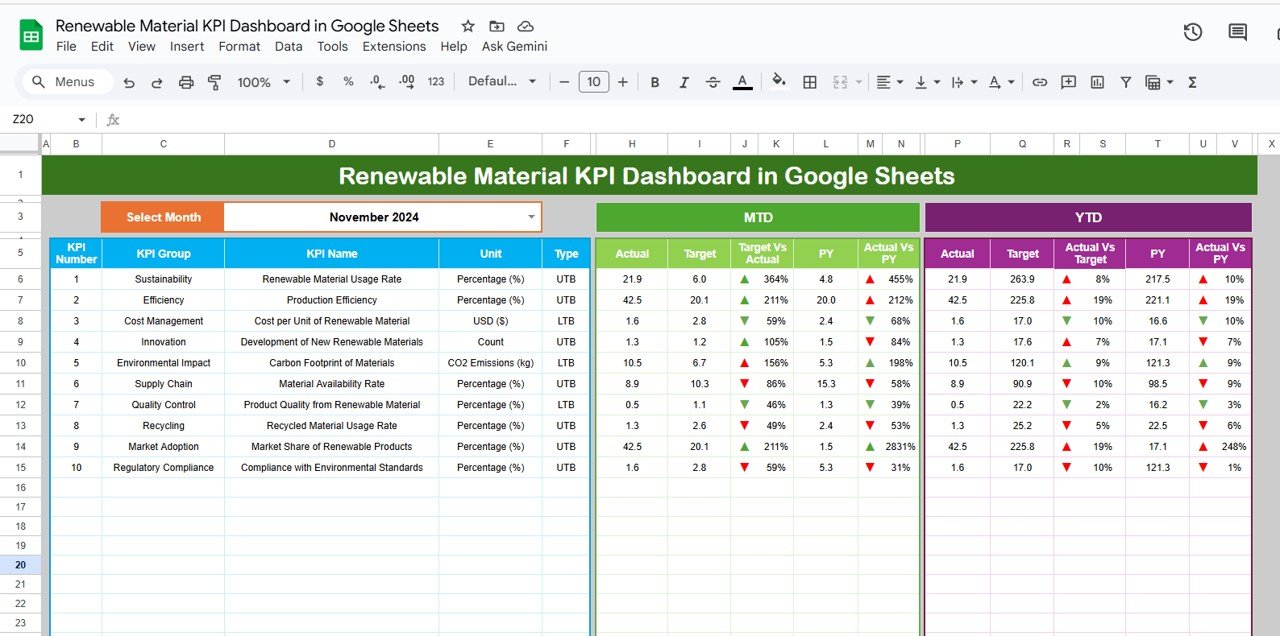
The central hub of the dashboard, combining visuals, KPI cards, and automated summaries for instant insights.
Features include:
📅 Month Selector (Cell D3): Switch between reporting periods effortlessly.
📈 MTD & YTD Comparisons: View Actual vs Target vs Previous Year at a glance.
🟢 Conditional Indicators: Up/down arrows and colors highlight performance shifts.
⚙️ Fully Automated Calculations: No formulas to edit manually.
KPI Cards Displayed:
Total Renewable Material Used (tons)
Renewable Material Percentage (%)
Recycled Content Ratio (%)
Material Waste (%)
Energy Usage per Unit (kWh/unit)
CO₂ Emissions (tons)
Procurement Cost per Ton ($)
Supplier Compliance (%)
Cost Savings through Renewable Sourcing ($)
Sustainability Rating (Index)
All indicators update automatically, helping users instantly interpret trends in renewable material adoption and environmental efficiency.
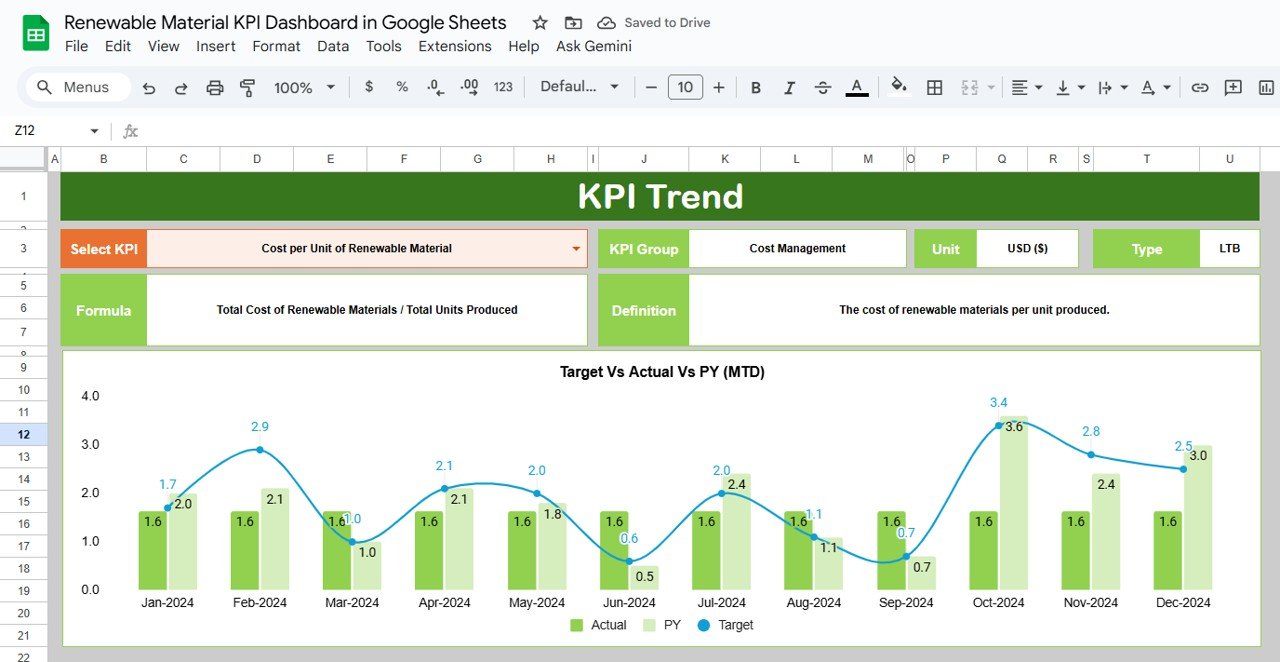
📉 KPI Trend Sheet Tab
Dive deeper into long-term KPI trends with interactive filters and graphs.
Dropdown in Range C3 to select any KPI.
Displays KPI Group, Unit, Type (UTB/LTB), Formula, and Definition.
Line and bar charts visualize month-wise MTD and YTD progression.
Perfect for tracking sustainability improvement trajectories or identifying areas requiring corrective action.
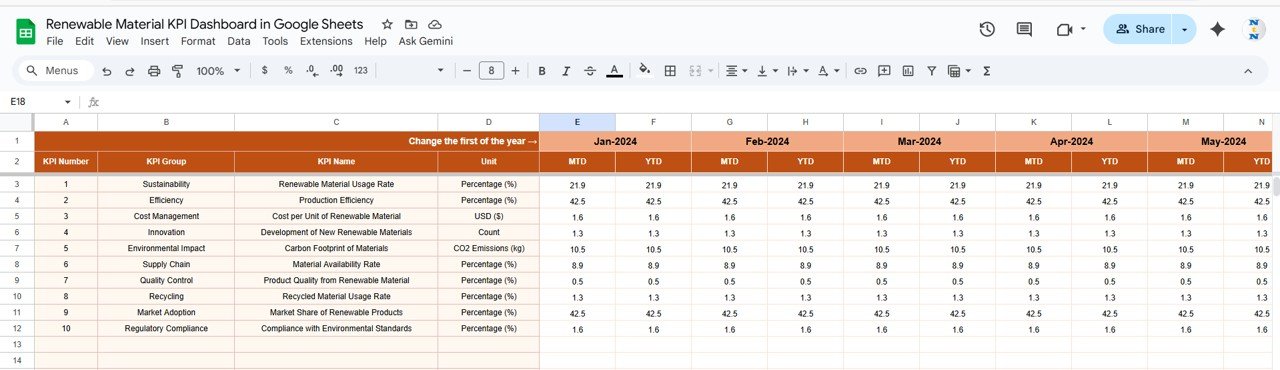
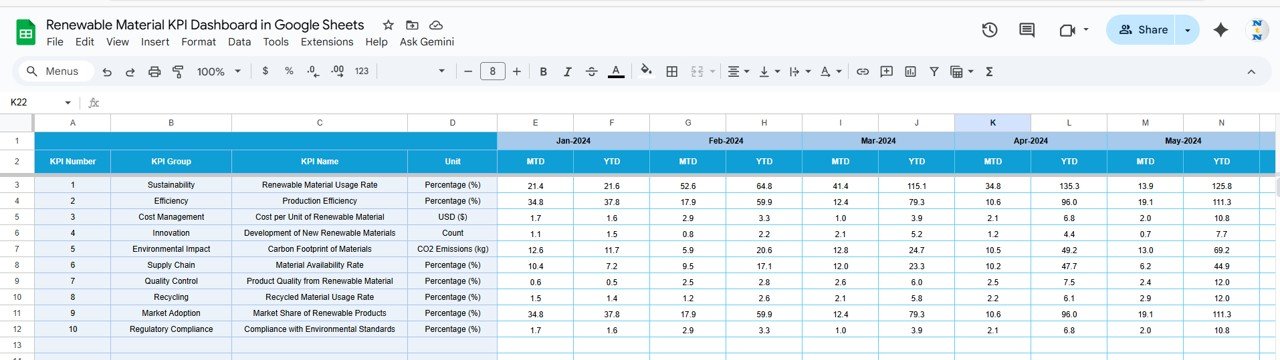
🧮 Actual Number Sheet Tab
The foundation of the dashboard — where users enter raw monthly performance data.
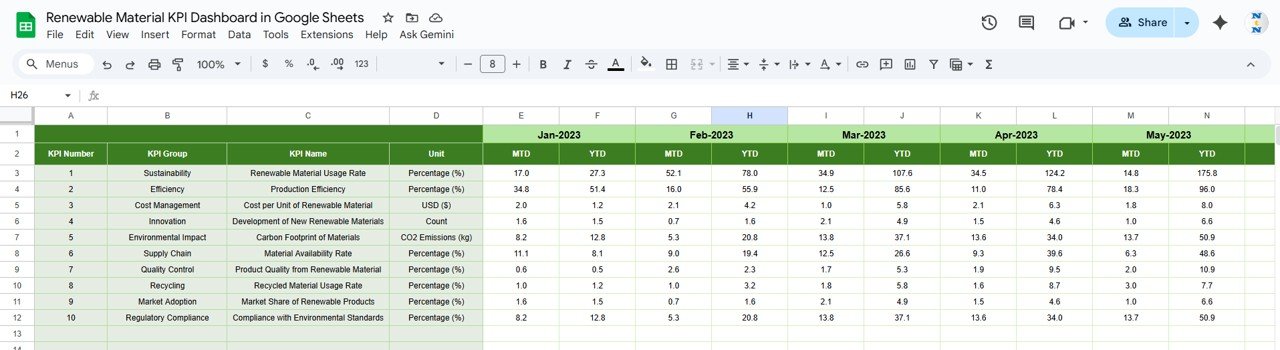
Columns for Month, MTD Actual, and YTD Actual.
Fiscal start month set in Range E1 to recalculate YTD automatically.
Drives every visualization on the dashboard.
🎯 Target Sheet Tab
Establish clear sustainability goals.
Define monthly and yearly targets for each KPI.
The dashboard calculates achievement % and displays red/green status automatically.
Use this sheet to track whether renewable material initiatives are meeting organizational expectations.
📆 Previous Year Number Sheet Tab
Benchmark your current sustainability progress against last year’s achievements.
Enables instant YoY comparisons.
Helps analyze seasonal performance patterns or long-term gains.
📘 KPI Definition Sheet Tab
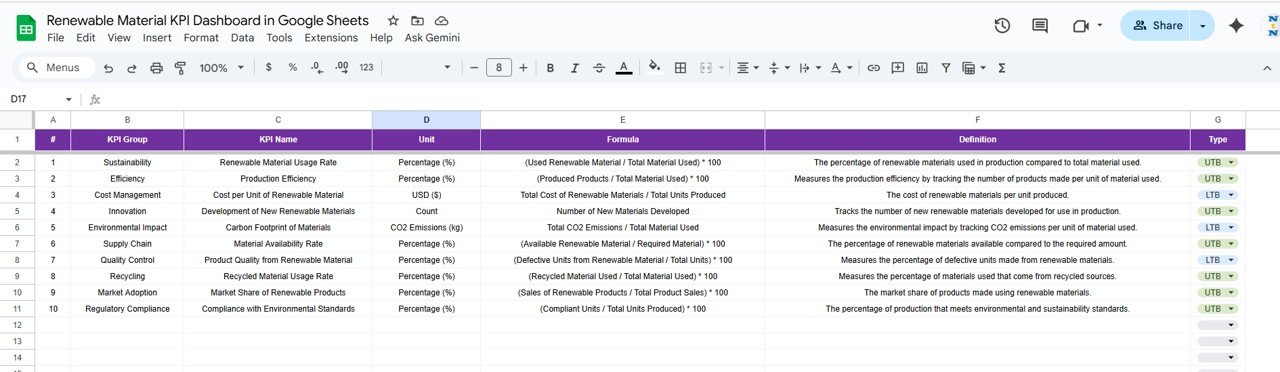
A complete KPI library ensuring clarity and data consistency.
Includes:
KPI Group | Unit | Formula | Definition | Type (UTB/LTB)
📦 What’s Inside the Dashboard
✅ Interactive Dashboard Sheet with automated charts
✅ MTD/YTD & YoY comparisons
✅ KPI Trend sheet for visual analysis
✅ Fully editable data and target tables
✅ Conditional formatting & color indicators
✅ Cloud-based collaboration via Google Sheets
🧑💼 Who Can Use This Dashboard
🌿 Sustainability Managers — Track renewable sourcing and waste reduction.
🏭 Procurement Teams — Evaluate supplier compliance and cost efficiency.
💡 Environmental Analysts — Monitor CO₂ emissions and energy usage.
📊 Operations Leaders — Identify areas to improve material efficiency.
🌍 Corporate Sustainability Officers — Report KPIs for ESG and CSR initiatives.
⚙️ Opportunities for Improvement
You can expand this dashboard by:
🌱 Integrating IoT data for real-time emission tracking.
🔄 Adding supplier-level analytics and regional breakdowns.
📈 Building forecast models for future renewable material demand.
✉️ Automating email alerts for low performance KPIs.
🧭 Linking to Google Data Studio for enhanced executive visuals.
🧠 Best Practices
✅ Update actual and target data monthly.
✅ Use consistent units (e.g., tons, kWh).
✅ Apply standard supplier/region dropdowns for accuracy.
✅ Review energy and emission KPIs quarterly.
✅ Backup data routinely for audit and ESG reporting.
🌟 Why Choose the Renewable Material KPI Dashboard in Google Sheets
🌿 All-in-one sustainability management system.
⚙️ Completely automated calculations and charts.
📈 Real-time performance against targets and previous year.
☁️ Google Sheets collaboration for cross-team transparency.
🧩 Fully customizable for any industry or organization size.
With this Renewable Material KPI Dashboard, businesses can transform environmental goals into measurable outcomes — driving sustainability performance through data-backed insights and actionable analytics. 🌱📊
🔗 Read the detailed blog post
Watch the step-by-step video Demo:
































Reviews
There are no reviews yet.