Struggling to track candidates, source effectiveness, or hiring trends? 📉
The Recruitment and Hiring Dashboard in Power BI is your all-in-one solution to streamline the entire hiring pipeline—track metrics, visualize insights, and make data-driven decisions in real-time.
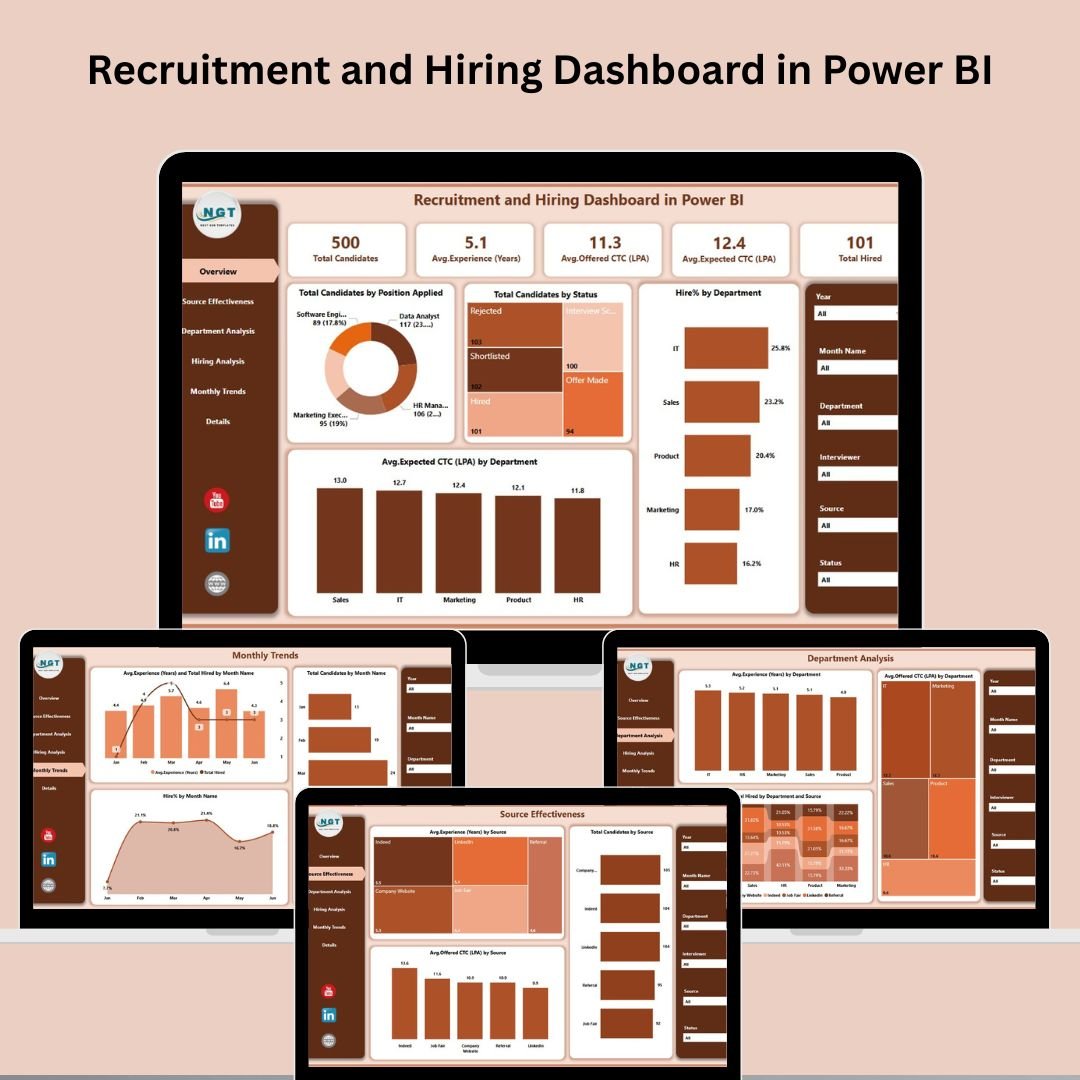
This ready-to-use dashboard transforms raw Excel data into powerful visuals and interactive reports, helping HR teams and recruitment professionals optimize hiring strategies, reduce costs, and improve candidate quality.
✅ Key Features of Recruitment and Hiring Dashboard in Power BI
📊 5 Dedicated Analytical Pages – Overview, Source Effectiveness, Department Analysis, Hiring Breakdown & Monthly Trends
🧩 6 Interactive Slicers Per Page – Filter by department, position, stage, source, month, and more
📈 Real-Time Visualizations – Auto-refresh charts and cards that respond to filters
💰 CTC, Experience & Volume Metrics – Gain complete visibility overcompensation trends and candidate experience
🎯 Department-Wise & Source-Wise Breakdown – Spot hiring patterns across teams and channels
📅 Hiring Trend Forecasting – Monitor monthly hiring activity to plan ahead
⚙️ Customizable Power BI Template – Modify visuals, filters, and layouts to suit your needs
📦 What’s Inside the Recruitment and Hiring Dashboard?
This Power BI template includes five powerful pages; each designed for specific HR insights:
📌 Overview Page
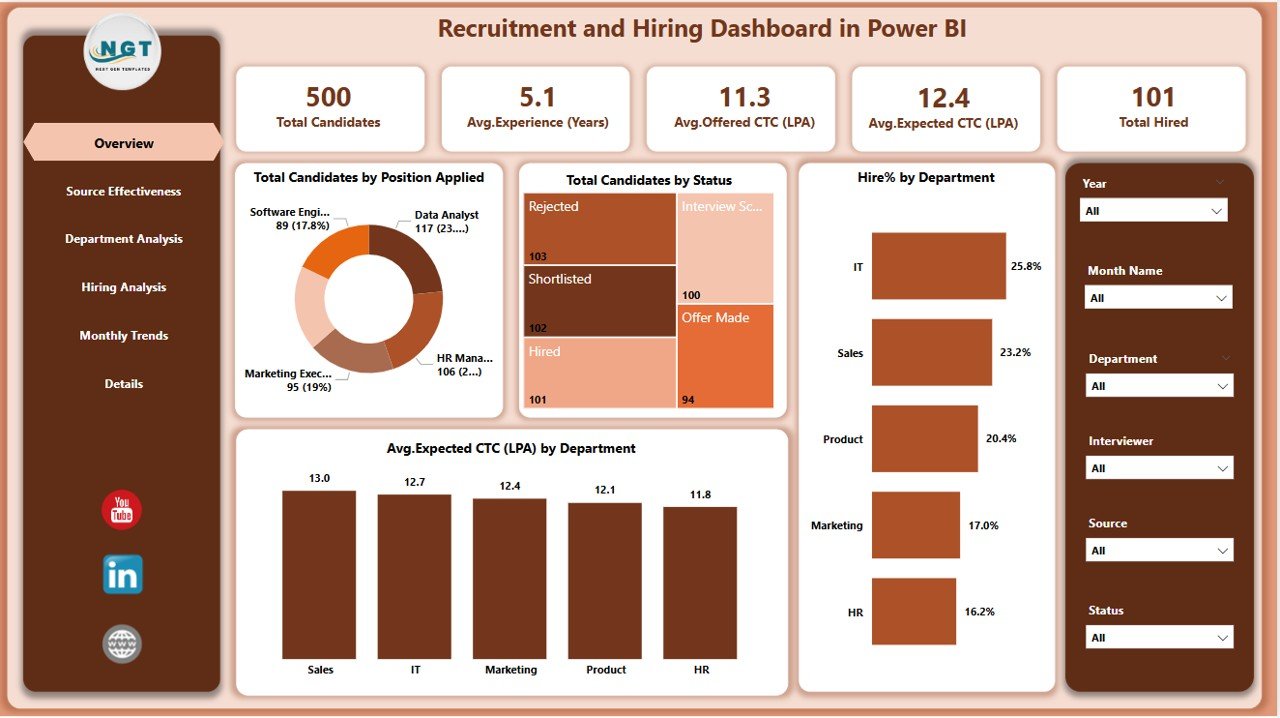
Your central summary with:
-
6 slicers (Department, Stage, Position, Source, Month, Status)
-
5 KPI Cards: Total Candidates, Hired Count, etc.
-
4 charts:
-
Candidates by Position
-
Candidates by Status
-
Hire % by Department
-
Average Expected CTC by Department
-
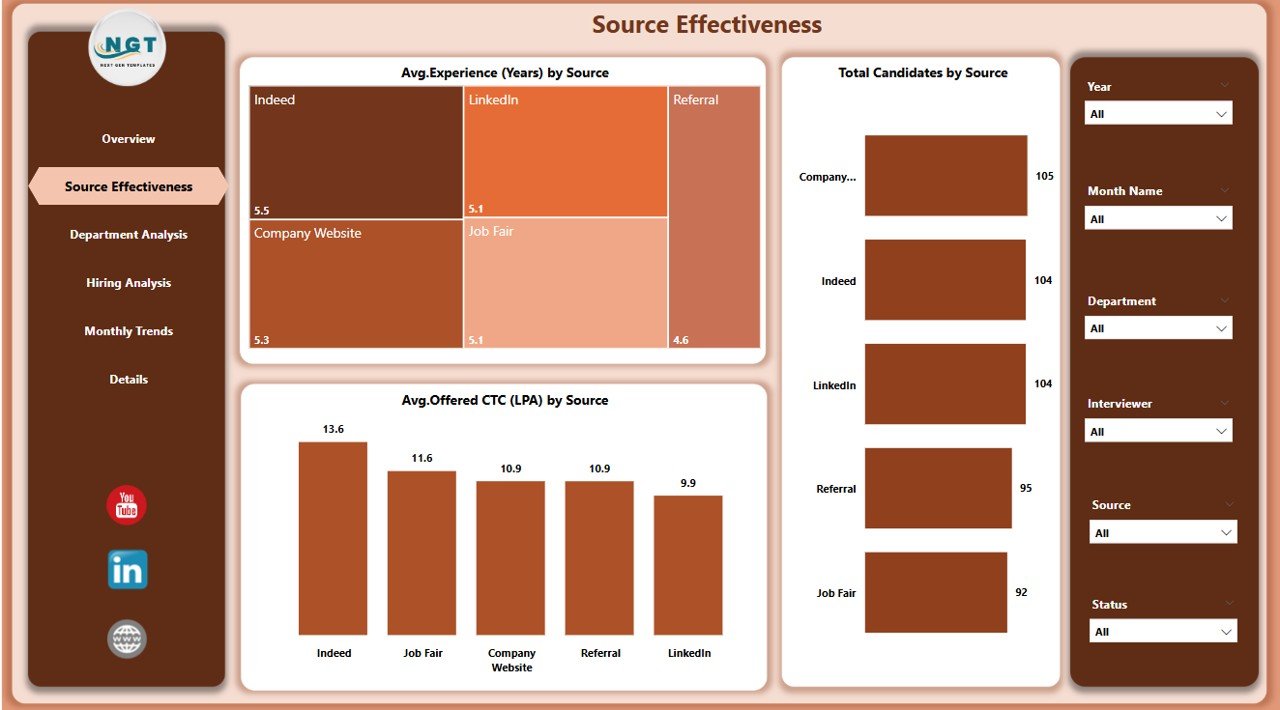
🌐 Source Effectiveness Page
Evaluate how each recruitment source is performing:
-
Average Experience by Source
-
Total Candidates by Source
-
Average Offered CTC by Source
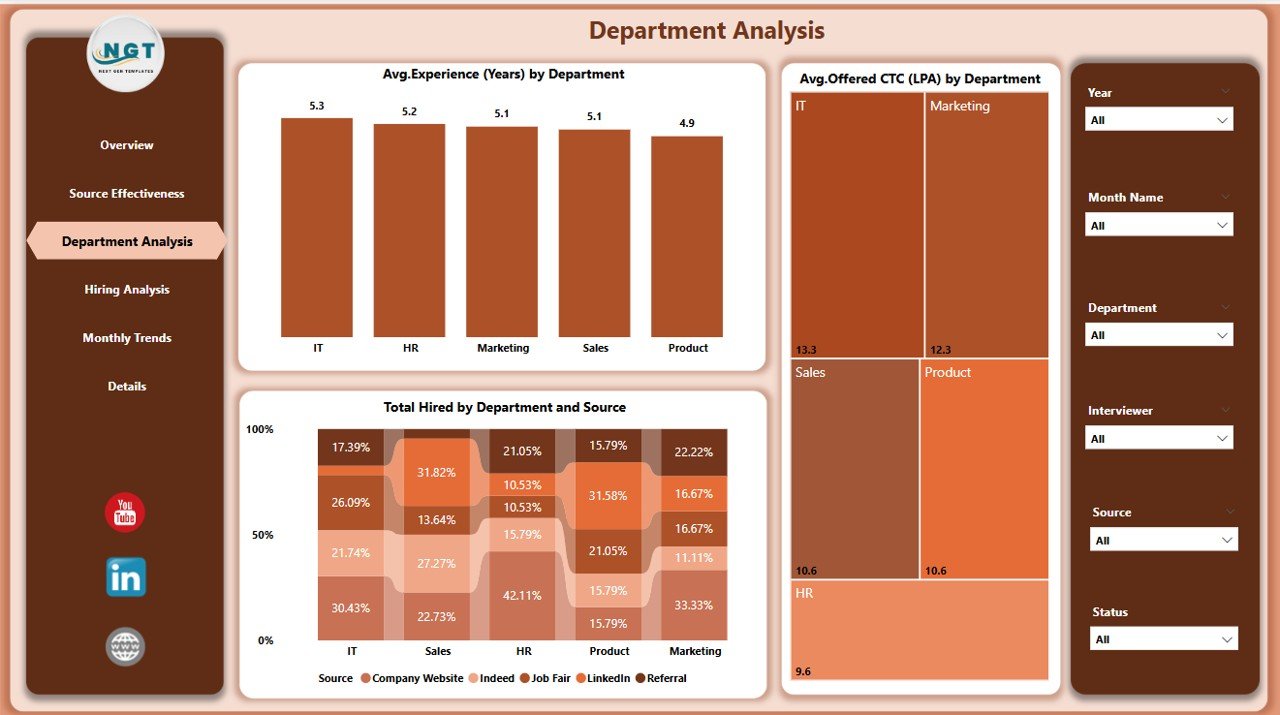
🏢 Department Analysis Page
Track recruitment by department:
-
Average Experience by Department
-
Average Offered CTC by Department
-
Total Hires by Department & Source
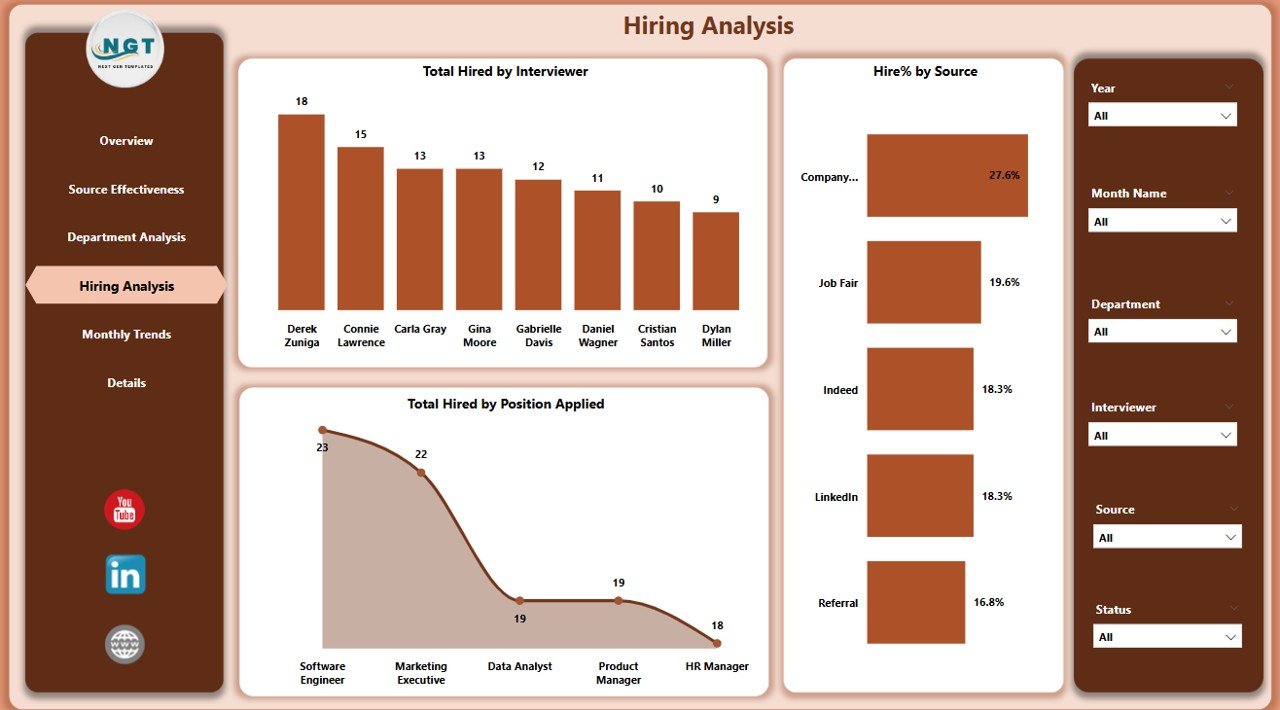
👥 Hiring Analysis Page
Deep-dive into actual hiring outcomes:
-
Total Hired by Department & Source
-
Experience and CTC data segmented by hires
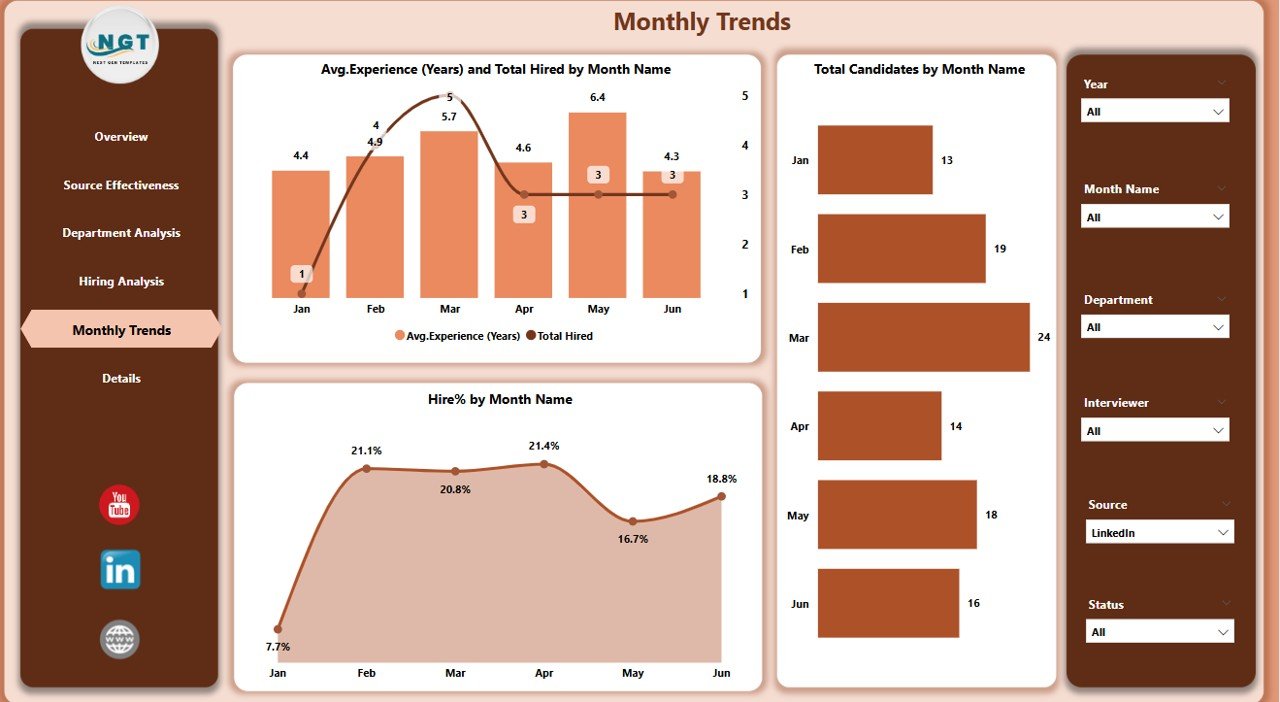
📆 Monthly Trends Page
Monitor hiring across time:
-
Total Hires by Month
-
Average Experience by Month
-
Hire % by Month
-
Total Candidates by Month
Each chart updates dynamically based on slicers—no manual adjustments needed!
🛠️ How to Use the Dashboard
-
Connect Your Excel Data File with fields for candidate details, departments, hiring status, source, experience, and CTC
-
Load Data into Power BI and ensure field mappings are correct
-
Navigate Between Pages using slicers for custom views
-
Analyze KPIs & Trends across positions, departments, and channels
-
Update Weekly or Monthly for real-time accuracy
-
Customize Layouts & Charts as needed using Power BI’s intuitive interface
👥 Who Can Benefit from This Dashboard?
💼 HR Professionals – Monitor recruitment metrics and hiring quality
🧑💼 Recruitment Managers – Identify bottlenecks and high-performing sources
🏢 Department Heads – Track hiring progress for their teams
📊 Talent Acquisition Teams – Optimize resource planning and hiring forecasts
📈 Executives – Gain strategic insight into organizational growth
🔗 Click here to read the Detailed blog post
🔗 Visit our YouTube channel to learn step-by-step video tutorials


Reviews
There are no reviews yet.