

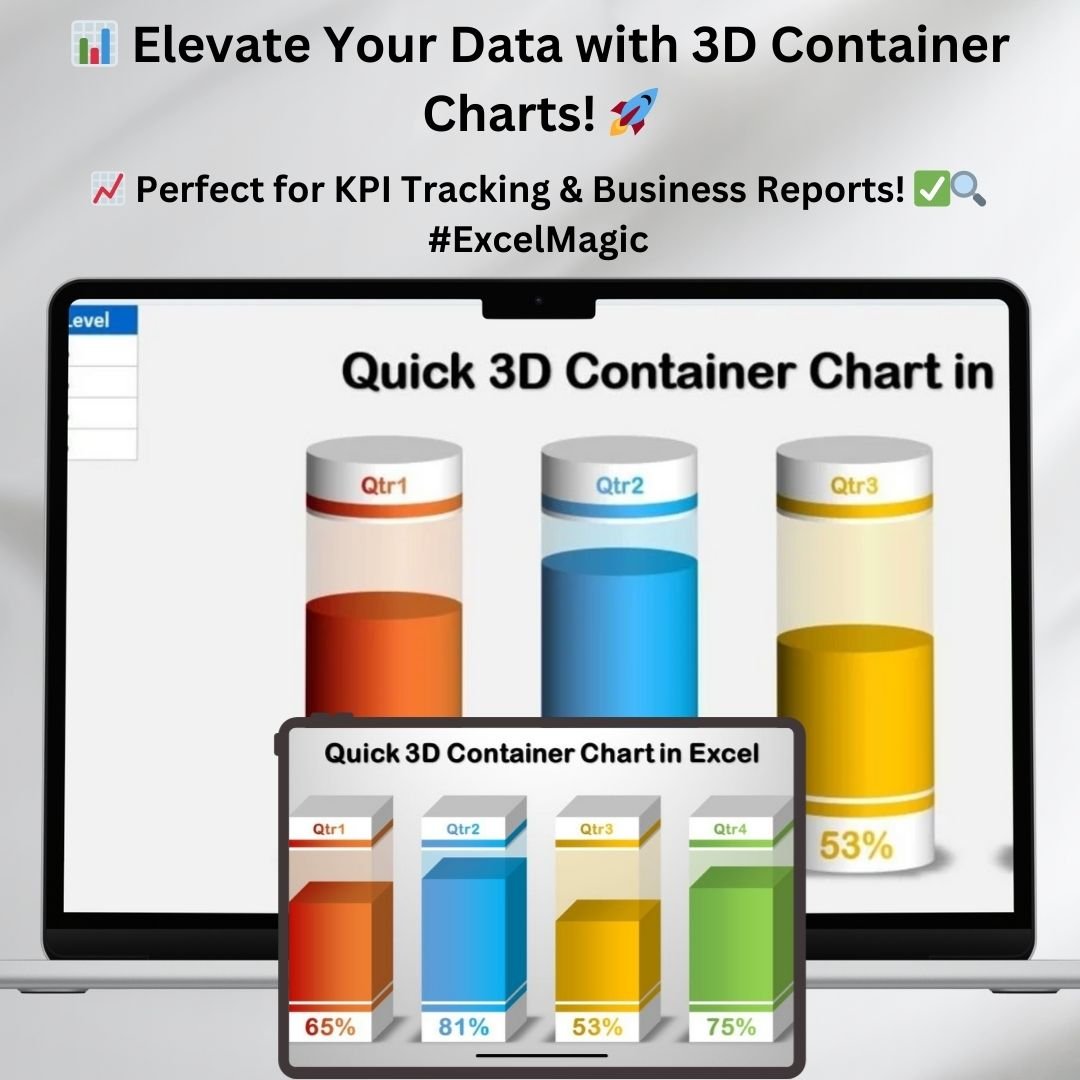
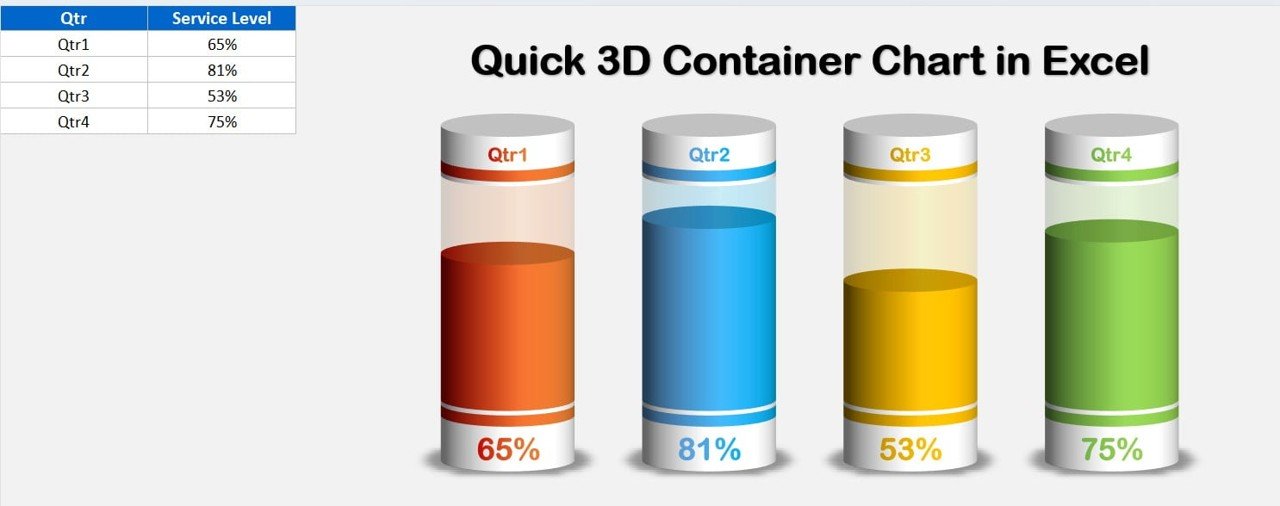

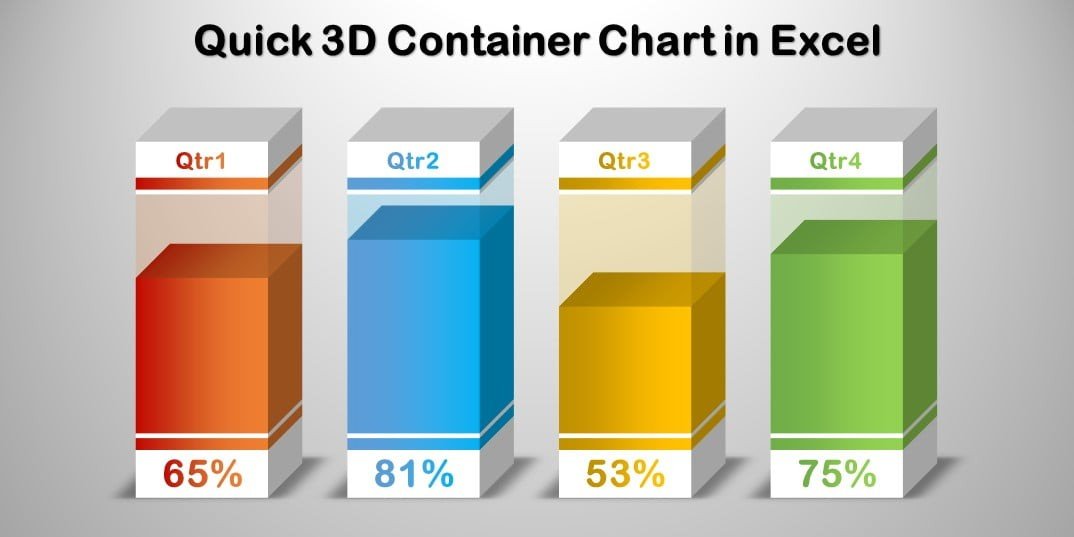
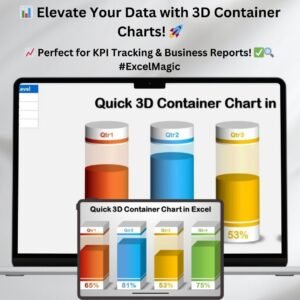
The Quick 3D Container Chart in Excel is a ready-made template that turns KPI metrics and business performance data into polished 3D visuals. It includes two chart styles, Cylinder and Box, for analysts, managers and anyone who presents results. You enter your numbers, the chart updates automatically, and you get report-ready visuals without VBA or coding.
Key Features of the 3D Container Chart in Excel
Two Unique 3D Chart Styles
- Choose between Cylinder and Box container-style charts.
- The modern look helps your data stand out in executive reports and presentations.
Built for Business Performance Metrics
- Track Service Level, Quality Score, Gross Margin, Revenue Growth, Customer Satisfaction and other KPIs.
- The visuals are intuitive, so decision-makers can read key performance indicators at a glance. This makes the template useful for KPI visualization.
Easy Data Input in Microsoft Excel
- No complex coding or VBA is needed. Enter your data and the chart updates automatically.
- Works with all versions of Microsoft Excel.
Fully Customizable
- Change colors, fonts and labels to match your brand or report theme.
- Adjust chart elements to show percentage values, absolute figures or comparative data.
Dynamic 3D Presentation
- The 3D effect adds depth and clarity, which makes data comparison more intuitive.
- It engages stakeholders and simplifies complex datasets so they can make better decisions.
Works with Your Business Dashboards
- Add the charts to your existing Excel dashboards, PowerPoint presentations and business reports.
- Supports financial, operational and marketing reporting.
Why Choose This Excel 3D Chart Template?
- Professional look and feel: These 3D container visuals have more impact than standard Excel charts.
- Saves time and effort: You don’t build charts from scratch. Add your data and the visuals update.
- Clearer business insights: Stakeholders and management get a clear snapshot of business performance.
- Ideal for reporting: Use the charts in monthly reports, executive summaries and decision-making sessions.
- No technical skills required: Users with basic Excel knowledge can use and modify this template.
What’s Included in the Download?
| Item | Details |
|---|---|
| Excel File | Contains both the Cylinder and Box 3D Container Charts |
| Pre-set formatting and formulas | Let you update data quickly |
| Step-by-step instructions | Explain how to customize the charts |
| Fully editable template | Can be adapted to your reporting needs |
Who Is This Template For?
- Business managers and executives who present KPIs such as Service Level, Quality Score and Gross Margin.
- Financial, operational and marketing teams who want more engaging reports.
- Analysts building an Excel dashboard who need a container-style KPI visual.
- Presenters preparing quarterly results, monthly reports or executive summaries in Excel or PowerPoint.
- Excel users of any skill level, since no VBA or coding is required.
How to Use the Quick 3D Container Chart in Excel
- Download the Excel file and open it in Microsoft Excel.
- Choose the Cylinder or Box chart style.
- Enter your KPI values, such as Service Level, Quality Score or Gross Margin. The chart updates automatically.
- Customize colors, fonts and labels to match your brand, following the included step-by-step instructions.
- Add the chart to your dashboard, business report or PowerPoint presentation.
Click here to read the detailed blog post
Visit our YouTube channel for step-by-step video tutorials: Youtube.com/@PKAnExcelExpert
Watch the step-by-step video tutorial:
Frequently Asked Questions
What chart styles are included?
The template includes two 3D container chart styles, Cylinder and Box, in one Excel file.
Do I need VBA or coding skills?
No. The template needs no VBA or coding. Enter your data and the chart updates automatically.
Which versions of Excel does it work with?
The template works with all versions of Microsoft Excel.
Which KPIs can I display?
It suits metrics such as Service Level, Quality Score, Gross Margin, Revenue Growth, Customer Satisfaction and other KPIs. You can show percentage values, absolute figures or comparative data.
Can I customize the design?
Yes. The template is fully editable, so you can change colors, fonts and labels to match your brand. Step-by-step customization instructions are included.
Can I use the charts in PowerPoint?
Yes. The charts fit into Excel dashboards, PowerPoint presentations and business reports.
Also check our Pro Gantt Chart in Excel with data entry form
Last updated: October 2026
Compatibility and Requirements
- Works in Microsoft Excel desktop (Excel 2016 or later, or Microsoft 365).
- No VBA or coding is needed. Microsoft’s guide to creating a chart explains how Excel charts work if you want to restyle them.
Related 3D and KPI Chart Templates
- 3D Gauge Chart in Excel: another 3D KPI visual
- Info-graphics: Stunning Thermometer Chart in Excel: a fill-to-target progress chart
- Mind-Blowing Excel Hack: 3D Waffle Charts in Just Steps: 3D waffle charts for percentages
- Group of Circle Charts in Excel: several KPIs as circles
- Data Analyst’s Chart & Visualization Pack: 10 chart templates for Excel and Google Sheets
Browse all Excel chart templates or the Excel dashboards.







Reviews
There are no reviews yet.