



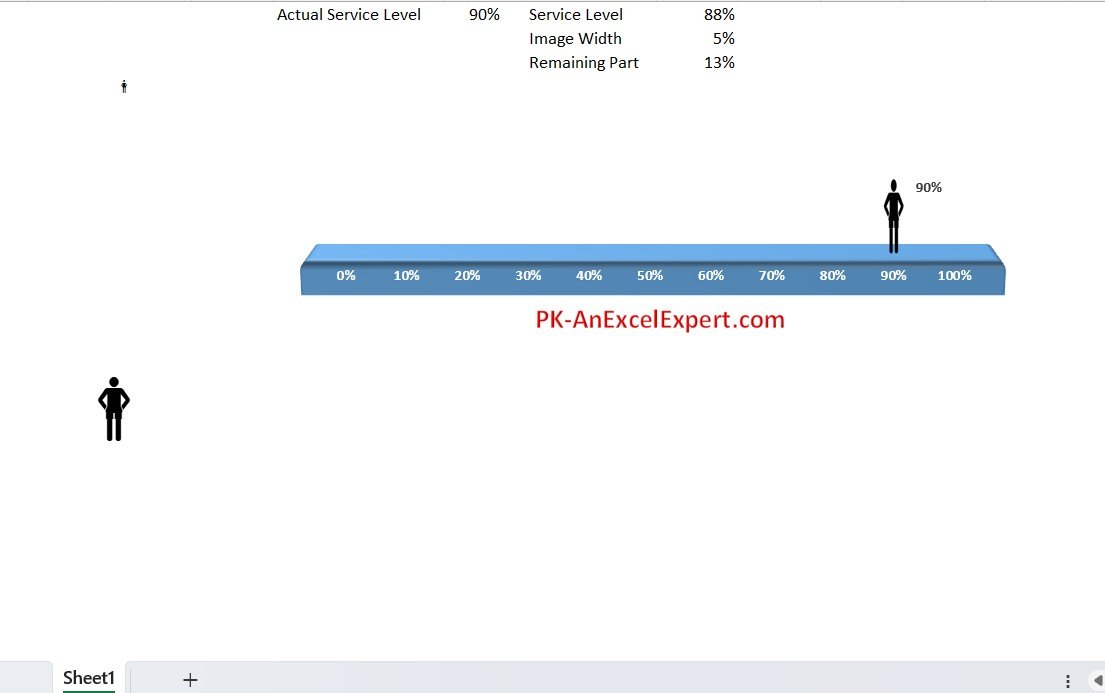
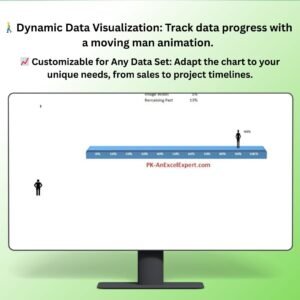
The Moving Man Chart in Excel is a unique and visually captivating way to present data in a dynamic format. Ideal for showcasing performance, progress, or any data that evolves over time, this chart adds a creative, animated element to your presentations or reports. The Moving Man Chart allows you to visualize the movement of data points across a defined timeline, creating an engaging, easy-to-understand visual that draws attention and helps make complex data more accessible.
Whether you’re a business analyst tracking sales performance, a project manager monitoring milestones, or a teacher explaining concepts like movement or progress over time, the Moving Man Chart in Excel helps you present data in a way that’s not only informative but also engaging. Perfect for presentations, dashboards, or any report that benefits from clear, animated visuals.
Key Features of the Moving Man Chart in Excel
🚶♂️ Dynamic and Engaging Visualization
The chart creates a visual animation, making it ideal for presentations or reports where you want to visually track progress, milestones, or data changes over time.
⚡ Customizable for Any Data Set
Easily adapt the chart to display any type of data that evolves over time, such as sales targets, project timelines, or employee performance. Customize the chart for your specific needs.
📈 Easy-to-Follow Animation
The moving man animation shows data in motion, making it easier to comprehend how data points change or progress over time. Track milestones, deadlines, or goals with clear and dynamic visuals.
📅 Timeline Tracking
Use the timeline feature to visualize changes over a set period. The moving man chart allows you to represent data over days, months, or any time frame, making it great for illustrating progress.
🖥️ Interactive & User-Friendly Interface
The Excel chart is easy to set up and use. With step-by-step instructions, even those with basic Excel knowledge can integrate this animated chart into their reports or presentations.
Why You’ll Love the Moving Man Chart in Excel
✅ Captivating Visuals for Your Data
Engage your audience with a creative, animated chart that shows data movement over time. The moving man chart makes any presentation or report more interactive and visually appealing.
✅ Simplify Complex Data
Transform complex or static data into a dynamic, easy-to-understand visual. Perfect for tracking progress on goals, projects, or any ongoing metric.
✅ Track Milestones & Deadlines
Use the chart to visually represent key milestones, deadlines, or target achievements. Track how quickly or slowly you’re moving toward a goal with clear visual markers.
✅ Adaptable to Any Data Set
This Excel chart is highly customizable to track various types of data, from project timelines to sales metrics to employee performance. Modify the chart to suit your data needs.
✅ Create Impactful Presentations
Add this unique chart to your business presentations, educational materials, or data reports to impress and engage your audience.
What’s Inside the Moving Man Chart Template?
- Animated Data Visualization: Visualize data progress with an engaging moving man animation.
- Customizable Timeframes: Track data points over any time period, whether it’s days, months, or even years.
- Interactive Timeline: Display progress, milestones, and deadlines clearly with a visual timeline.
- Easy Setup: The template includes clear, step-by-step instructions for integrating the chart into your Excel reports.
- Real-Time Data Updates: Easily update the chart with new data, and watch the animation adjust accordingly.
How to Use the Moving Man Chart in Excel
1️⃣ Download the Template: Get instant access to your Moving Man Chart in Excel.
2️⃣ Input Your Data: Enter the data you want to visualize over time, such as progress, sales numbers, or milestones.
3️⃣ Watch the Animation: As you update the data, the moving man chart animates to show the progress in a dynamic way.
4️⃣ Embed in Presentations or Reports: Use the chart in PowerPoint, Excel reports, or dashboards to make your data more engaging.
Who Can Benefit from the Moving Man Chart in Excel?
🔹 Business Analysts & Managers
🔹 Sales Teams & Marketing Professionals
🔹 Project Managers & Team Leaders
🔹 Educators & Trainers
🔹 Data Analysts & Report Creators
🔹 Anyone Looking for Dynamic Data Visualization Tools
Transform how your present data with the Moving Man Chart in Excel. Make progress, milestones, and goals visually engaging and easy to follow for your audience and take your presentations to the next level.
Click here to read the Detailed blog post
Visit our YouTube channel to learn step-by-step video tutorials
Youtube.com/@PKAnExcelExpert
Watch the step-by-step video tutorial:
Compatibility and Requirements
- Works in Microsoft Excel desktop (Excel 2016 or later, or Microsoft 365).
- The visuals are standard Excel charts. Microsoft’s guide Create a chart from start to finish covers how to edit chart data, colors and labels.
Frequently Asked Questions
What does the Moving Man Chart show?
A figure that moves along a timeline to show progress, such as sales against a target, project milestones or employee performance.
Does the chart move when I change the data?
Yes. When you update the data, the moving man adjusts to show the new progress.
Which time periods can I use?
Days, months or years. You set the time frame that fits your data.
Can I use the chart in PowerPoint?
Yes. You can use it in PowerPoint, Excel reports or dashboards.
Related Infographic Chart Templates
- Road and Flag infographics chart in Excel: another road-style progress visual.
- Info-graphics: Stunning Thermometer Chart in Excel: show progress toward a target.
- Animated Progress Circle Chart: an animated progress chart.
- Animated Speedometer Chart in Excel: an animated speedometer for one value.
- Data Analyst’s Chart & Visualization Pack: 10 chart templates for Excel and Google Sheets in one bundle.
Browse all Excel chart and visualization templates.

















Reviews
There are no reviews yet.