

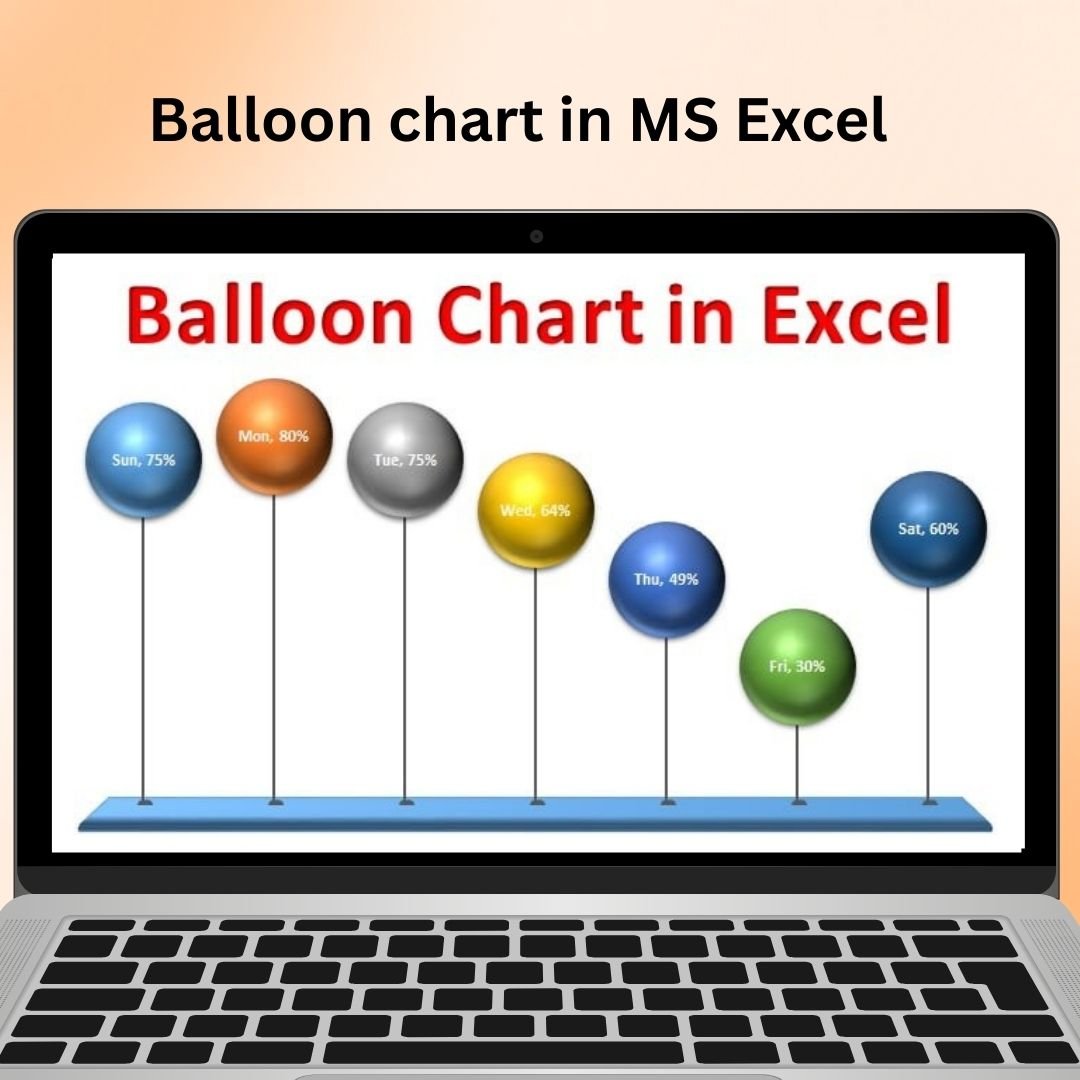

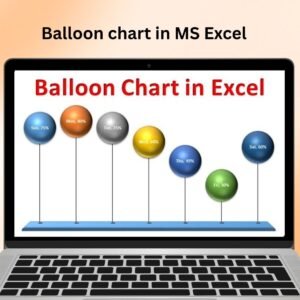
The Balloon Chart in MS Excel is a visually striking and dynamic tool that allows you to display your data in a unique way. This chart type uses circles or balloons to represent data points, with the size of the balloon indicating the value, and the positioning of the balloon highlighting relationships between different data sets. It’s a powerful way to track performance metrics, sales figures, project milestones, or any other data points in a format that’s both engaging and informative.
With the Balloon Chart in MS Excel, you can add an extra layer of visual appeal to your business reports, presentations, and dashboards. It helps you easily illustrate key trends, outliers, and important values while making the data more memorable. Whether you’re working with time-series data, KPIs, or comparing multiple variables, the balloon chart provides a fresh, clear, and interactive way to visualize your information.
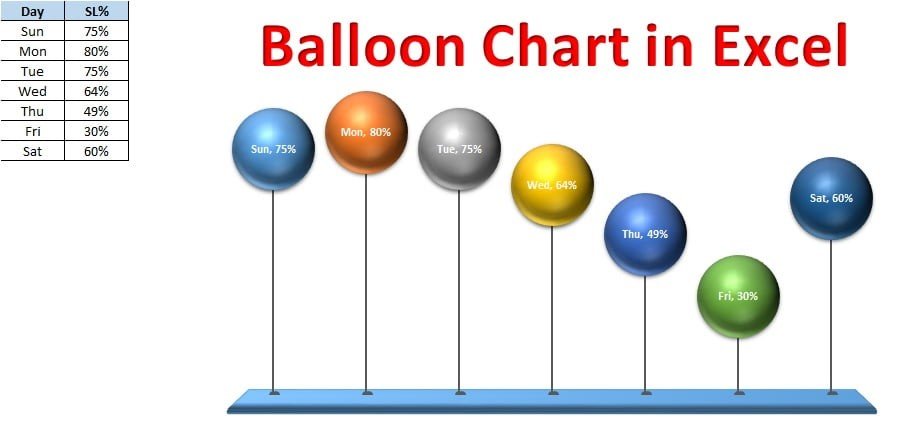
Key Features of the Balloon Chart in MS Excel
📌 Unique and Engaging Visualization
The Balloon Chart uses colorful balloons (or circles) to represent individual data points, with their size visually reflecting the value of the data. This allows you to easily identify trends, outliers, and key values in a visually appealing way.
🛠 Customizable Balloon Size
You can set the size of each balloon based on your data. Larger balloons can represent higher values, while smaller ones represent lower values. This makes it easy to visually compare different values in the same dataset.
💡 Track Multiple Variables
Balloon charts allow you to track multiple variables by adjusting the position of the balloons along the X and Y axes. This makes it a great tool for comparing two or more sets of data and visualizing relationships between them.
🔢 Dynamic Data Representation
As your data changes, the chart updates automatically, ensuring that the balloon sizes and positions reflect the latest information. This dynamic feature makes the balloon chart ideal for real-time data tracking and presentations.
🚀 Perfect for Dashboards and Reports
The Balloon Chart is ideal for use in dashboards, performance reviews, and business reports. Its visually appealing format captures attention, helping stakeholders easily interpret data and understand trends.
📊 Highly Customizable Design
This tool offers flexibility in terms of color schemes, balloon sizes, labels, and other design elements. You can tailor the chart to fit your branding or personal preferences, ensuring that it aligns with your report’s or presentation’s theme.
⚙ Why You’ll Love the Balloon Chart in MS Excel
✅ Visually Engaging – Create eye-catching, memorable charts using balloon shapes. ✅ Track Multiple Variables – Compare and track multiple datasets at once. ✅ Dynamic Representation – Automatically adjust as your data changes. ✅ Customizable Design – Adjust balloon sizes, colors, and positions to fit your needs. ✅ Perfect for Dashboards – Enhance your business dashboards and reports with this chart type.
📂 What’s Inside the Balloon Chart in MS Excel Tool?
- Balloon Visualization: Use balloons to represent data points, making the chart visually engaging.
- Customizable Sizes: Adjust the size of the balloons to reflect data values.
- Multiple Variables: Track multiple data sets and compare them in a single chart.
- Step-by-Step Setup Guide: Easy-to-follow instructions for setting up and customizing the balloon chart.
🔍 How to Use the Balloon Chart in MS Excel
1️⃣ Download the Template – Instant access to the Excel file upon purchase. 2️⃣ Enter Your Data – Input your data into the Excel sheet. 3️⃣ Set Balloon Sizes and Positions – Adjust the size of each balloon based on your data and position it based on two variables. 4️⃣ Monitor Trends – Use the balloon chart to track trends and compare datasets. 5️⃣ Present and Share – Use the chart in presentations, dashboards, and reports to visually communicate your data.
🎯 Who Can Benefit from the Balloon Chart in MS Excel? 🔹 Business Analysts
🔹 Sales Managers
🔹 Project Managers
🔹 Marketing Teams
🔹 Financial Analysts
🔹 Anyone who needs to represent complex data in a visually engaging and easy-to-understand format
The Balloon Chart in MS Excel is an excellent tool for enhancing your data presentations, tracking key performance indicators, and visualizing relationships between multiple variables. Whether you’re working with business reports, project milestones, or KPIs, this chart will help bring your data to life in a creative and insightful way.
Click here to read the Detailed blog post
https://www.pk-anexcelexpert.com/balloon-chart-in-ms-excel/
Visit our YouTube channel to learn step-by-step video tutorials
Watch the step-by-step video tutorial:
Compatibility and Requirements
- Works in Microsoft Excel desktop (Excel 2016 or later, or Microsoft 365).
- Microsoft’s chart basics are in Create a chart from start to finish.
Frequently Asked Questions
How does a balloon chart show data?
Each data point is a balloon. Its size shows the value, and its position on the X and Y axes shows how two variables relate.
Does the chart update when data changes?
Yes. Balloon sizes and positions update automatically when you change the data.
Can I change colors and labels?
Yes. You can change color schemes, balloon sizes, labels and other design elements.
Is there a video tutorial?
Yes. A step-by-step video tutorial is embedded above, and a detailed blog post is linked.
Related Chart Templates
- Group of Circle Charts in Excel: several circle charts on one sheet
- Dynamic Circle Chart in Excel: a circle chart that changes with your inputs
- Horizontal Timeline Chart using Scatter Chart in Excel: another chart built on X and Y positions
- Comparison Infographics in Excel: compare options side by side
- Data Analyst’s Chart & Visualization Pack: 10 chart templates for Excel and Google Sheets in one download
Browse all Excel chart templates or the Excel dashboards.










Reviews
There are no reviews yet.