



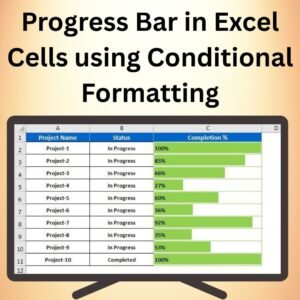
The Progress Bar in Excel Cells Using Conditional Formatting is an efficient and visually appealing way to track progress directly within your Excel sheet. This tool allows you to create dynamic progress bars inside your cells, helping you visualize performance, completion rates, and project milestones with ease. Whether you are monitoring project progress, sales targets, or any other progress-based metrics, the Progress Bar provides an immediate visual cue for how much has been achieved versus how much is left to accomplish.
By leveraging Excel’s built-in Conditional Formatting, you can set up these progress bars in a few simple steps. The chart updates automatically based on your data, ensuring that you always have an up-to-date visualization of your progress. It is fully customizable, allowing you to adjust colors, sizes, and data thresholds to suit your needs.

Key Features of the Progress Bar in Excel Cells Using Conditional Formatting
📌 Dynamic Progress Tracking
Use Conditional Formatting to create interactive progress bars inside Excel cells. The progress bars automatically update as your data changes, providing a real-time visualization of your progress.
🛠 Customizable Appearance
Easily customize the color, size, and style of the progress bars to suit your needs. Choose from different color gradients, fill styles, and even set the thresholds for when the bar reaches specific milestones (e.g., 50%, 75%, or 100%).
💡 Simple Setup with Conditional Formatting
The setup process is simple and doesn’t require advanced Excel skills. With just a few clicks, you can apply Conditional Formatting rules to create and manage progress bars in your Excel sheet.
🔢 Easy to Monitor Progress
Track any performance metric—whether it’s the percentage of tasks completed, sales goals reached, or project milestones achieved—with easy-to-understand progress bars that update dynamically as data changes.
🚀 Real-Time Updates
As soon as you update your data, the progress bar adjusts automatically to reflect the new completion status. This ensures that you have up-to-date visual feedback on your progress without having to manually update the chart.
📊 Perfect for Dashboards and Reports
The Progress Bar is ideal for dashboards and reports, allowing you to clearly present progress against goals. Its easy-to-read visual format ensures that stakeholders can quickly grasp key data points.
⚙ User-Friendly Interface
With its straightforward setup and customization options, the Progress Bar in Excel Cells is perfect for both beginner and advanced Excel users. The template provides clear instructions for creating and adjusting the progress bars.
🚀 Why You’ll Love the Progress Bar in Excel Cells Using Conditional Formatting
✅ Real-Time Tracking – Automatically update progress bars as data changes. ✅ Customizable Design – Adjust colors, sizes, and thresholds to fit your needs. ✅ Simple Setup – Use Conditional Formatting to quickly apply progress bars to your data. ✅ Clear Data Visualization – Easily track performance metrics with clear, dynamic progress bars. ✅ Perfect for Dashboards – Enhance your dashboards and reports with visually appealing progress bars.
📂 What’s Inside the Progress Bar in Excel Cells Using Conditional Formatting?
- Dynamic Progress Bars: Automatically updating progress bars using Conditional Formatting.
- Customizable Appearance: Adjust colors, sizes, and thresholds to match your needs.
- Step-by-Step Setup Guide: Clear instructions to help you create the progress bars in Excel.
- Real-Time Data Updates: The progress bars adjust automatically as data changes.
🔍 How to Use the Progress Bar in Excel Cells Using Conditional Formatting
1️⃣ Download the Template – Instant access to the Excel file upon purchase. 2️⃣ Input Your Data – Enter data that represents progress, such as percentages or milestones. 3️⃣ Apply Conditional Formatting – Use the instructions to apply Conditional Formatting to create progress bars. 4️⃣ Customize the Design – Adjust colors and thresholds to suit your needs. 5️⃣ Monitor Progress – Watch the progress bars update as you input new data or track performance over time.
🎯 Who Can Benefit from the Progress Bar in Excel Cells Using Conditional Formatting? 🔹 Project Managers
🔹 Sales Teams
🔹 Business Analysts
🔹 Financial Analysts
🔹 Operations Managers
🔹 Anyone needing to track and visualize progress within Excel
Enhance your project tracking and goal monitoring with the Progress Bar in Excel Cells Using Conditional Formatting. This simple, yet powerful tool helps you visually display your progress and stay on top of your objectives.
Click here to read the Detailed blog post
https://www.pk-anexcelexpert.com/progress-bar-in-excel-cells-using-conditional-formatting/
Visit our YouTube channel to learn step-by-step video tutorials
Watch the step-by-step video tutorial:
Compatibility and Requirements
- Works in Microsoft Excel desktop (Excel 2016 or later, or Microsoft 365).
- The bars use Excel’s built-in Conditional Formatting, so no add-ins are needed.
- If you also want a regular chart next to the bars, Microsoft’s guide Create a chart from start to finish walks through it.
Frequently Asked Questions
How do the progress bars work?
They are built with Excel’s Conditional Formatting. When you change a value, the bar in that cell grows or shrinks to show the new completion level.
Can I change the colors and thresholds?
Yes. You can adjust the color, size and style of the bars and set thresholds for milestones such as 50%, 75% or 100%.
Do I need advanced Excel skills?
No. The file includes a step-by-step setup guide, and applying the rules takes a few clicks.
What can I track with it?
Any value that shows progress, such as the share of tasks completed, sales goals reached or project milestones achieved.
Related Progress Chart Templates
- Stylish Progress Bar chart in Excel: a progress bar as a chart instead of in cells
- Dynamic Colorful Progress Bars in Excel cells: more colorful in-cell progress bars
- Progress Bar Chart in Excel: a simple progress bar chart
- Dynamic Conditional Formatting in Excel: conditional formatting that changes with your inputs
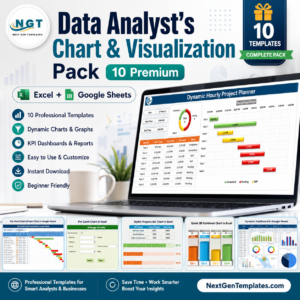
- Data Analyst’s Chart & Visualization Pack: 10 chart templates in one bundle
Browse all Excel charts and visualization templates.






Reviews
There are no reviews yet.