

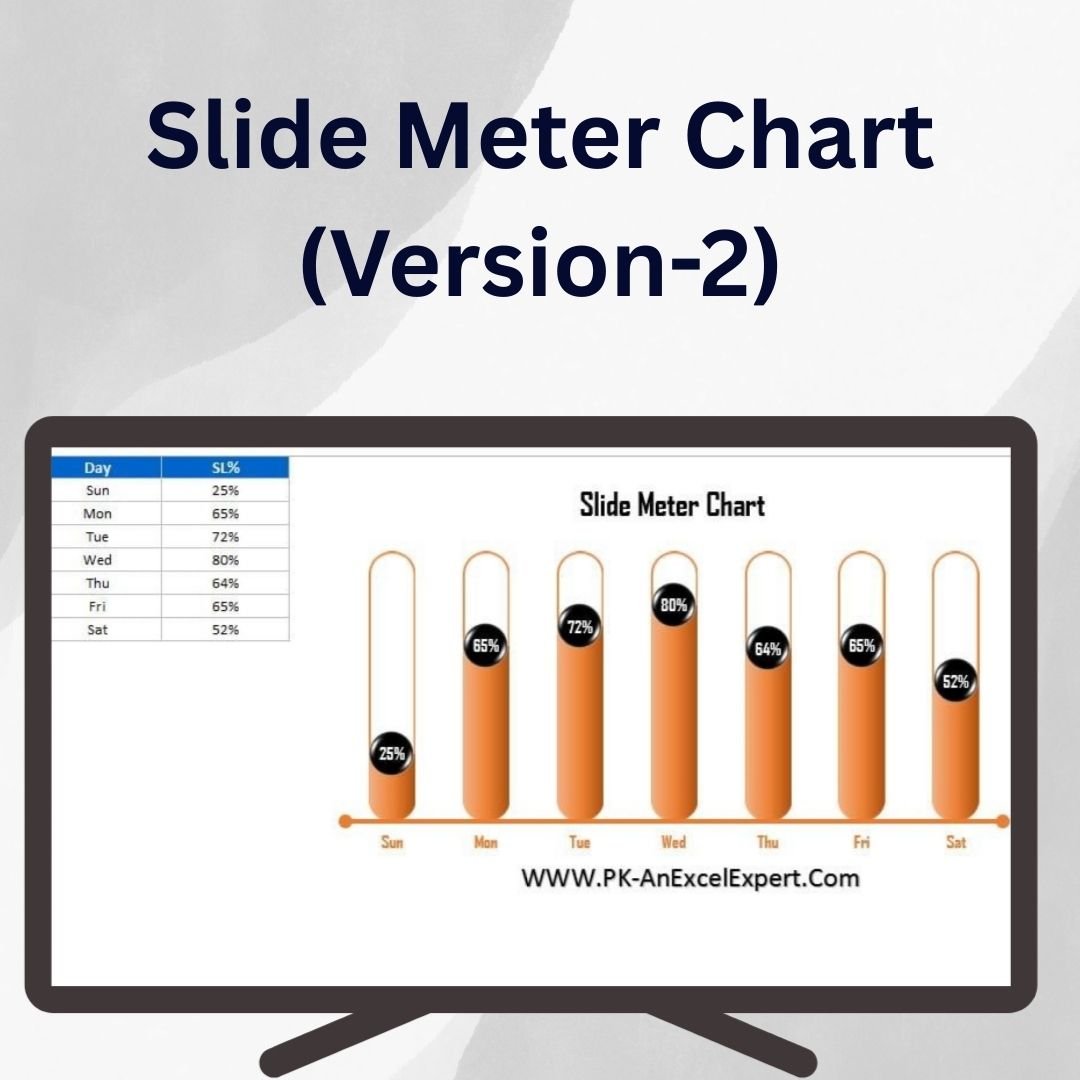

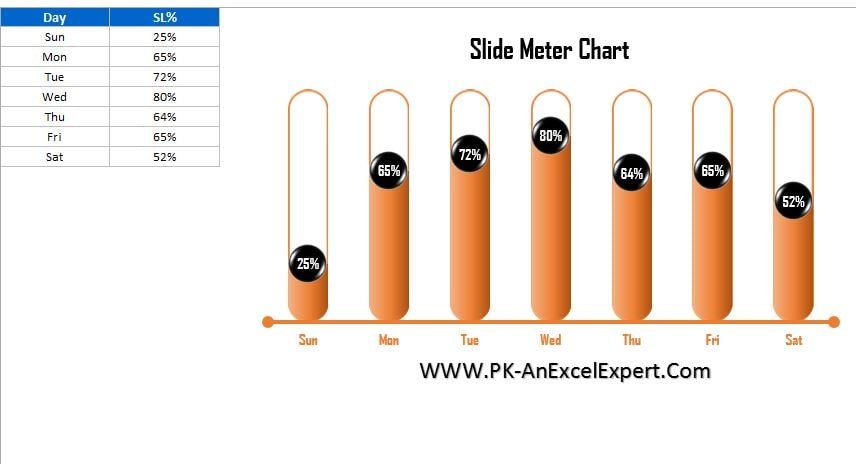
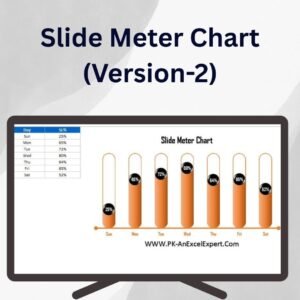
The Slide Meter Chart Version 2 in Excel is an advanced data visualization tool that allows you to track and present performance data in a sleek, interactive meter-style chart. This tool is perfect for showcasing progress towards a goal, whether it’s sales targets, project milestones, or any other performance metric. The Slide Meter Chart not only provides a clear visual representation of progress, but also allows for smooth and dynamic updates, making it ideal for dashboards and reports.
Version 2 of the Slide Meter Chart introduces enhanced features for better customization and improved interactivity. The chart uses a sliding meter to visually indicate progress, offering a modern and professional way to represent data. With full control over colors, labels, and data ranges, you can customize the chart to suit your needs. This chart is perfect for presentations, business reports, and performance tracking, ensuring that your audience can quickly and easily interpret key metrics.
Key Features of the Slide Meter Chart Version 2
📌 Sleek and Interactive Meter Design
The Slide Meter Chart offers a unique, sleek design that represents your data in a sliding meter format. The chart updates dynamically based on the data input, offering a real-time visual of progress towards a goal.
🛠 Customizable Appearance
This version of the Slide Meter Chart allows you to adjust the color scheme, labels, and data ranges to align with your presentation style. Choose from a variety of colors for the meter to make the chart visually appealing and easy to interpret.
💡 Real-Time Data Updates
As your data changes, the Slide Meter Chart automatically adjusts, providing real-time tracking of progress. This feature ensures that your data is always up to date, whether you are monitoring sales figures, project completion, or other performance metrics.
🔢 Precise Goal Tracking
Track goals with precision by setting custom thresholds that trigger specific color changes in the meter. This allows you to clearly highlight when a target has been met, is near completion, or needs urgent attention.
🚀 Professional and Engaging Visualization
The Slide Meter Chart Version 2 is designed to offer a professional and engaging way to display data in business reports, presentations, or dashboards. Its interactive nature ensures that your audience remains engaged while easily understanding key performance indicators.
📊 Perfect for Dashboards and Presentations
Use this chart in your Excel dashboards or presentations to provide a clear and impactful representation of progress. The interactive design enhances your reports, making them more visually compelling and easier to follow.
⚙ User-Friendly Setup
Setting up the Slide Meter Chart Version 2 is easy and doesn’t require advanced Excel skills. The setup is simple, and the chart comes with clear instructions on how to input your data and adjust the settings.
🚀 Why You’ll Love the Slide Meter Chart Version 2
✅ Dynamic Visual Updates – The meter updates in real-time as your data changes. ✅ Customizable Design – Adjust colors, labels, and ranges to match your needs. ✅ Easy Setup – Simple, step-by-step instructions for quick integration. ✅ Perfect for Dashboards – Ideal for reports and dashboards where progress tracking is essential. ✅ Professional Look – A sleek and modern design to enhance your business presentations.
📂 What’s Inside the Slide Meter Chart Version 2?
- Interactive Slide Meter: A dynamic and visually appealing chart that tracks progress.
- Customizable Colors and Labels: Fully adjustable to match your branding or reporting style.
- Real-Time Data Updates: The chart automatically updates as you input new data.
- Clear Setup Instructions: Step-by-step instructions to create and customize your chart.
🔍 How to Use the Slide Meter Chart Version 2
1️⃣ Download the Template – Instant access to the Excel file upon purchase. 2️⃣ Input Your Data – Enter the relevant performance data, such as sales progress or project completion. 3️⃣ Customize the Chart – Adjust the color, labels, and thresholds to suit your needs. 4️⃣ Monitor Progress – Watch the meter update as you input data, providing a real-time view of progress. 5️⃣ Share and Present – Use the chart in your business reports or dashboards to provide a clear visual of progress.
🎯 Who Can Benefit from the Slide Meter Chart Version 2? 🔹 Sales Teams
🔹 Project Managers
🔹 Business Analysts
🔹 Operations Managers
🔹 Financial Analysts
🔹 Anyone looking for a clear, dynamic way to track performance and progress
Track progress with the Slide Meter Chart Version 2 in Excel. This interactive, customizable chart provides a modern and professional way to visualize progress, ensuring that your audience stays engaged and informed.
Click here to read the Detailed blog post
https://www.pk-anexcelexpert.com/slide-meter-chart-version-2/






Reviews
There are no reviews yet.