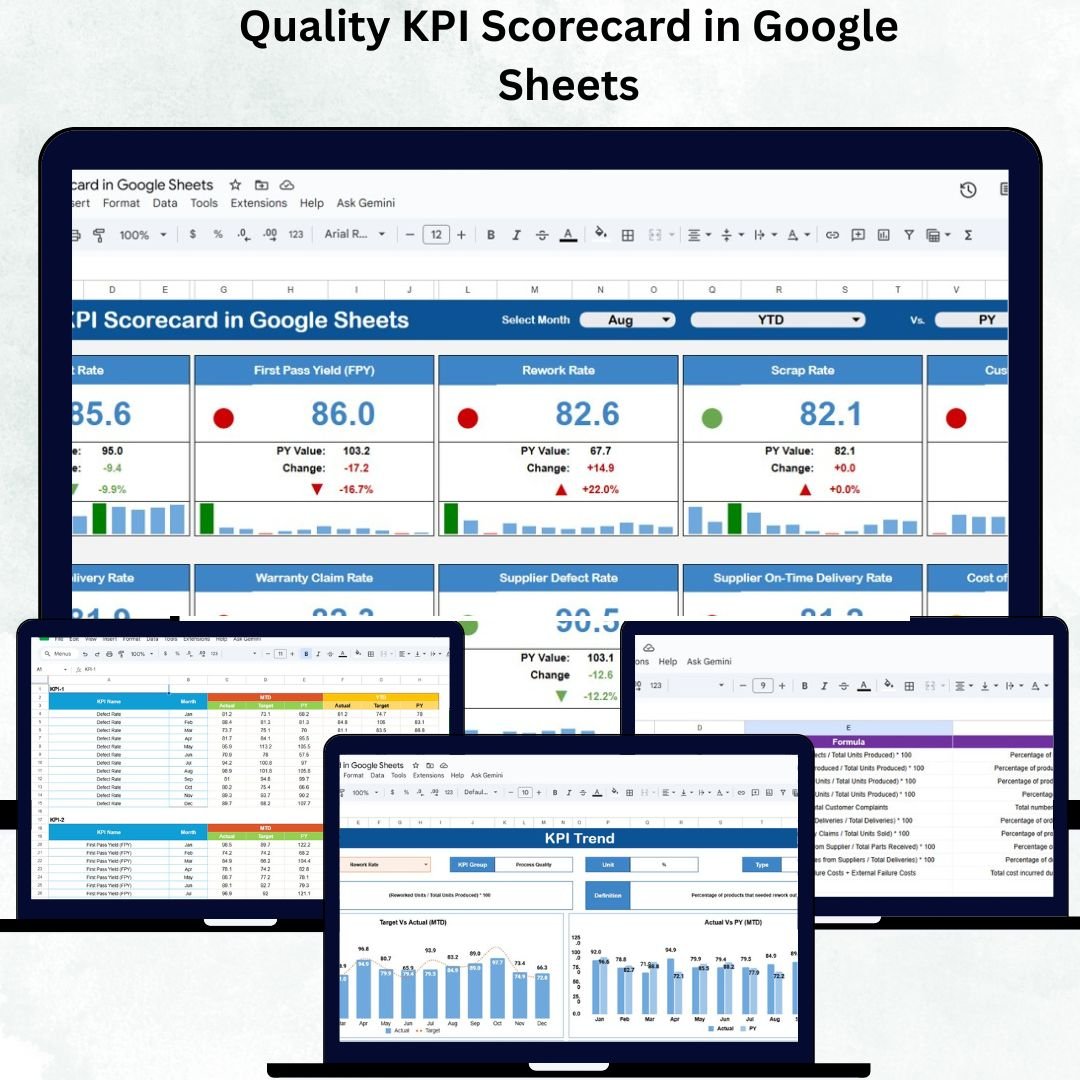
Quality assurance is the foundation of operational excellence. The Quality KPI Scorecard in Google Sheets is a ready-to-use, interactive tool designed to help businesses monitor, measure, and improve quality performance in real time.
Built entirely in Google Sheets, this scorecard consolidates your organization’s critical quality metrics — from defect rates and customer satisfaction to production efficiency — into one powerful visual dashboard. It enables quality managers, production heads, and compliance teams to make informed decisions and ensure continuous improvement without needing any additional software or coding.
📘 What Is a Quality KPI Scorecard in Google Sheets?
A Quality KPI Scorecard is a dynamic performance-tracking tool that captures and visualizes key quality indicators (KPIs) across various departments or projects.
It helps organizations:
-
Track and compare Actual vs Target performance for each KPI
-
View data in Month-to-Date (MTD) or Year-to-Date (YTD) formats
-
Identify improvement areas instantly through visual alerts and trend arrows
Because it’s cloud-based, multiple team members can update and view it simultaneously, ensuring real-time collaboration and transparent reporting.
📊 Scorecard Sheet Tab Overview
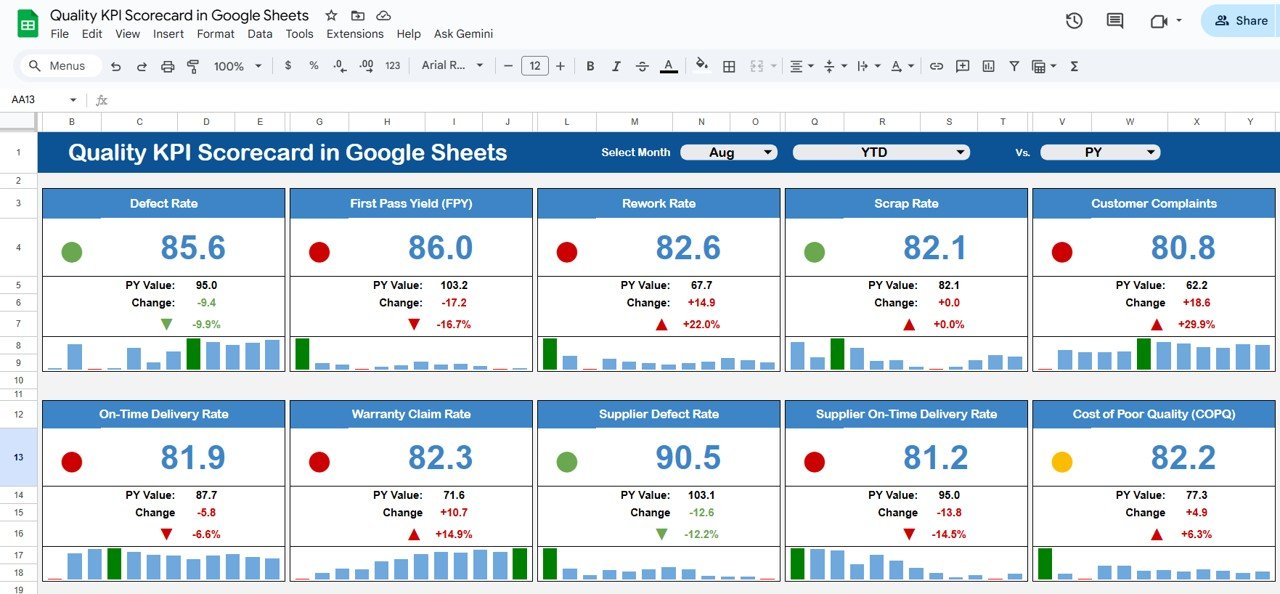
The Scorecard Sheet serves as the main dashboard, offering a visual snapshot of organizational quality performance.
🔹 Key Features
-
Month Selector (Cell D3): Select any month to instantly update all KPI visuals.
-
MTD/YTD Toggle: Switch between monthly and yearly views with one click.
-
Traffic Light Indicators:
🟢 Green = Target Achieved
🟡 Yellow = Slightly Below Target
🔴 Red = Underperformance -
Trend Arrows: Show improvement or decline vs previous month with percentage change.
Every visual element updates automatically based on the data in the backend sheets, ensuring accurate, real-time performance monitoring.
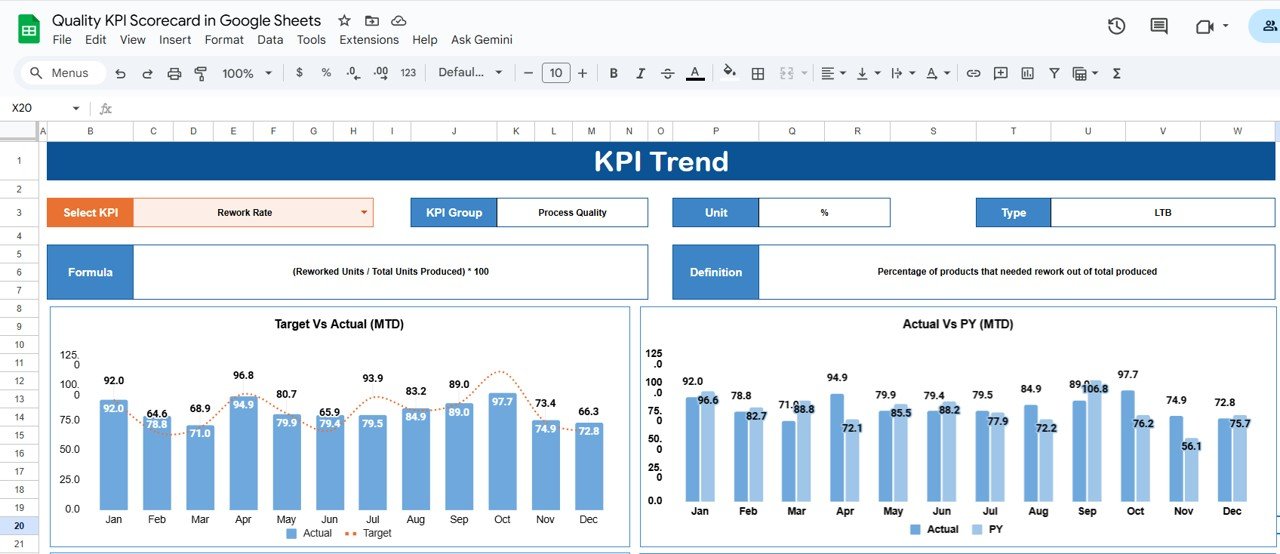
📈 KPI Trend Sheet Tab
The KPI Trend Sheet provides in-depth performance insights for individual KPIs over time.
Features:
-
Dropdown Selector (Cell C3): Choose any KPI to visualize its performance history.
-
Displayed Details:
-
KPI Group (e.g., Product Quality, Customer Experience, Process Efficiency)
-
Unit (%, Count, or Score)
-
Formula and Definition
-
Type — UTB (Upper The Better) or LTB (Lower The Better)
-
-
Dynamic Chart: Displays KPI trends across months or quarters.
This sheet is invaluable for identifying recurring quality issues or long-term improvement patterns.
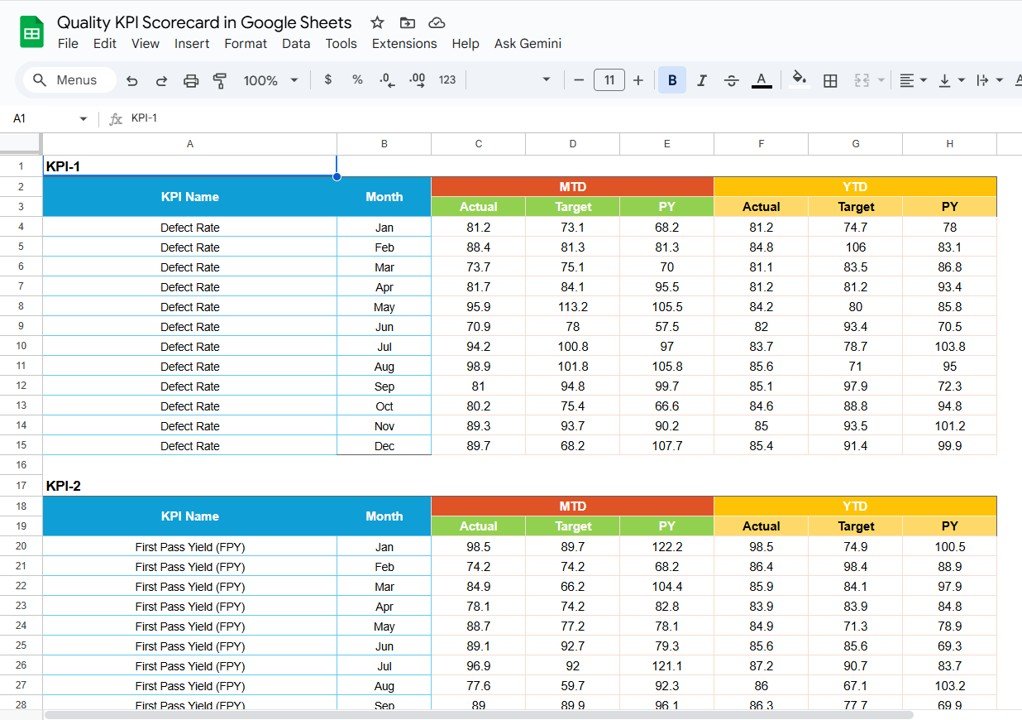
🧾 Data Input Sheet Tab
The Data Input Sheet is the foundation of the scorecard. It stores actual and target KPI data for each month.
Data Structure:
| KPI Name | Month | MTD Actual | MTD Target | YTD Actual | YTD Target |
-
As soon as you update a value, all visuals and calculations refresh automatically.
-
No manual recalculations or additional formulas are required.
This ensures your scorecard remains accurate, responsive, and maintenance-free.
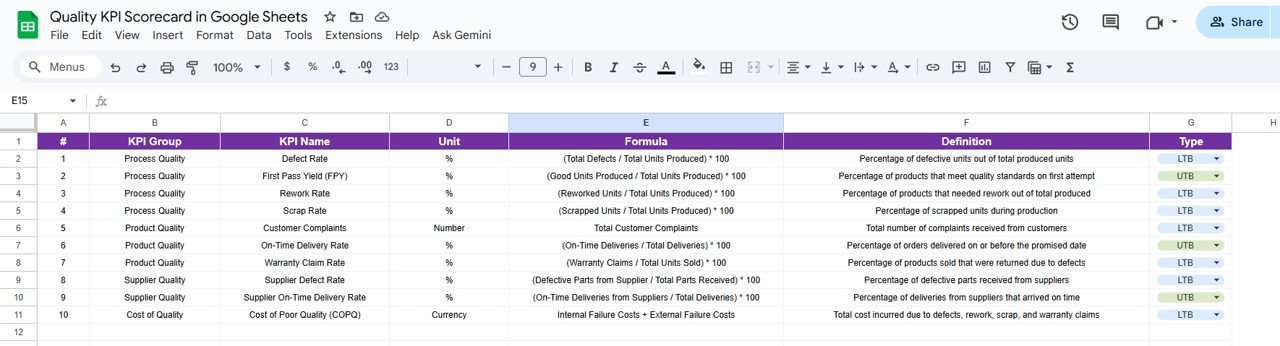
📚 KPI Definition Sheet Tab
This tab defines every KPI used in the scorecard to maintain clarity and standardization.
Columns Include:
-
KPI Group (e.g., Manufacturing, Customer Feedback, Compliance)
-
KPI Name
-
Unit
-
Formula
-
Definition
-
Type (UTB/LTB)
By maintaining this reference, all users interpret metrics consistently across teams.
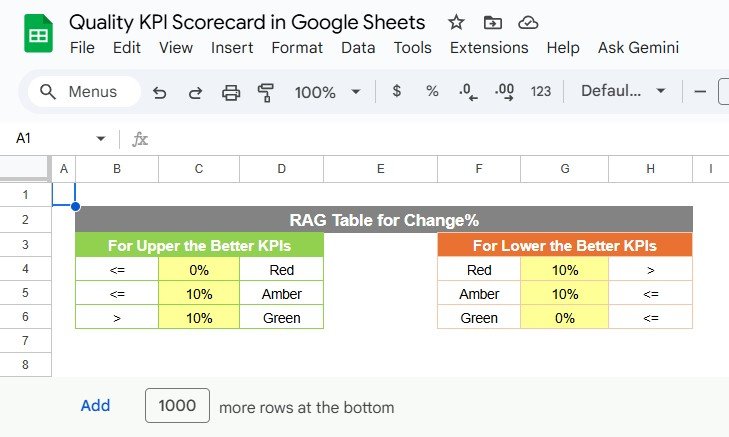
🎨 Color Settings
The Color Settings Sheet allows customization of threshold levels for KPI visualization.
Define your performance cut-offs for Good, Average, and Poor scores, and the traffic light indicators will automatically apply these rules.
🌟 Advantages of the Quality KPI Scorecard
-
📊 Real-Time Visualization: Instant performance monitoring for all KPIs.
-
⚙️ Automated Insights: Built-in logic for color coding and performance trends.
-
🧩 Customizable Structure: Add or modify KPIs as per business needs.
-
☁️ Cloud-Based Collaboration: Accessible to multiple users simultaneously.
-
✅ Accurate Reporting: Reduces manual calculation errors.
-
📅 MTD & YTD Views: Track both monthly and yearly progress easily.
-
🔍 Transparent Performance Tracking: Enhances management visibility.
🚀 Opportunities for Improvement
Enhance the dashboard’s capabilities with the following add-ons:
-
🔗 Automated Data Import: Connect with QA or production databases.
-
📧 Email Alerts: Notify stakeholders when KPIs fall below thresholds.
-
🔍 Drill-Down Filters: Enable department or project-level analysis.
-
🧾 CAPA Integration: Link corrective and preventive action logs.
-
📊 Looker Studio Integration: Upgrade visuals with advanced dashboards.
💡 Best Practices for Using the Scorecard
✅ Update Monthly: Enter data consistently to ensure reliable insights.
✅ Define KPIs Clearly: Keep definitions and formulas transparent.
✅ Set Realistic Targets: Align goals with achievable benchmarks.
✅ Monitor Trends: Review the KPI Trend tab for recurring issues.
✅ Control Access: Limit edit permissions to authorized quality personnel.
✅ Encourage Accountability: Use the dashboard in review meetings.
👥 Who Can Use This Scorecard
-
Quality Managers: Monitor production or service quality KPIs.
-
Operations Teams: Track process efficiency and defect trends.
-
Customer Service Heads: Evaluate satisfaction and complaint rates.
-
Compliance Officers: Ensure adherence to industry standards.
-
Executives: Gain a transparent view of quality performance across the organization.
✅ Conclusion
The Quality KPI Scorecard in Google Sheets is a comprehensive, visual, and automated tool for monitoring quality performance. With real-time updates, traffic lights, and trend indicators, it transforms static data into actionable insights.
It helps organizations uphold high standards, detect issues early, and ensure continuous improvement — all from within a simple, accessible, and collaborative Google Sheet.
If your goal is to drive quality excellence through data, this scorecard is your perfect solution.
🔗 Read the full guide and explore tutorials on
Watch the step-by-step video Demo:


Reviews
There are no reviews yet.