
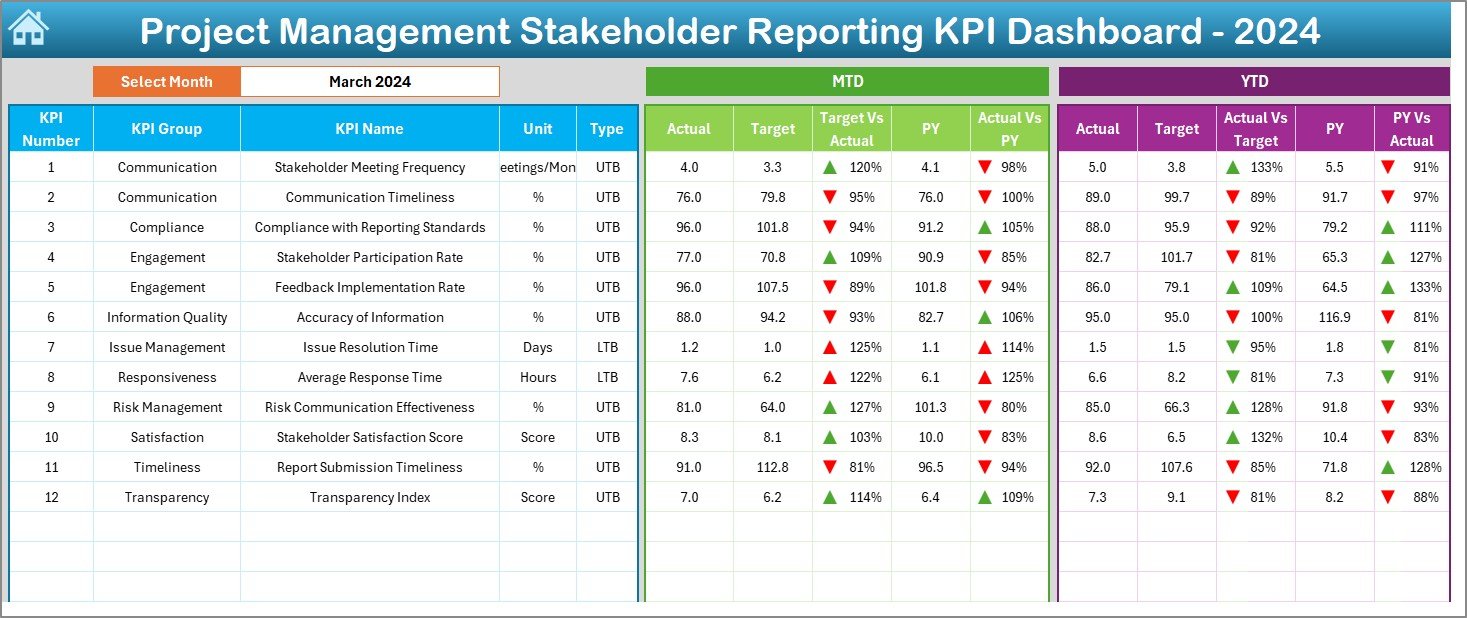
The Project Management Stakeholder Reporting KPI Dashboard in Excel is a powerful tool designed to provide project managers, team leaders, and organizations with real-time insights into project performance. This Excel-based dashboard allows for easy tracking and reporting of key performance indicators (KPIs), ensuring that stakeholders are always up-to-date on the project’s progress.
With features that enable you to monitor key metrics like project completion rate, budget variance, schedule variance, and resource allocation, this dashboard empowers you to make data-driven decisions, optimize resources, and manage risks effectively. The easy-to-use interface and customizable features make this dashboard an essential tool for any project management team.
Key Features of the Project Management Stakeholder Reporting KPI Dashboard in Excel
📊 Real-Time Performance Tracking
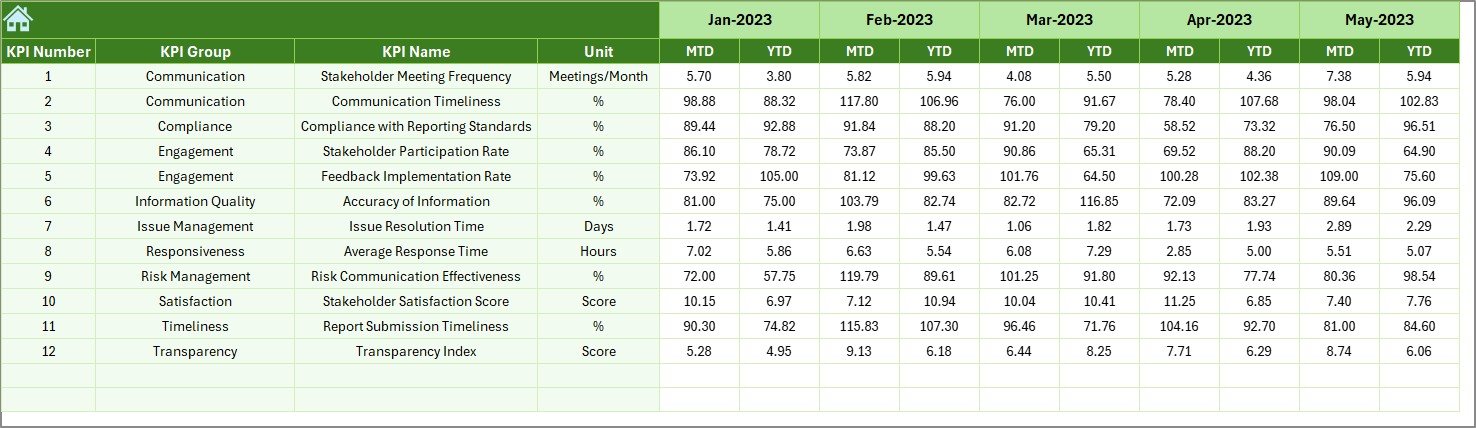
Monitor key project performance indicators such as budget variance, schedule variance, project completion rates, and more. This helps you evaluate whether the project is on track or facing any potential delays.
📈 Stakeholder Reporting
Generate reports for project stakeholders with a single click. Keep stakeholders informed with visual performance metrics that highlight project progress, risks, and accomplishments.
💼 Resource Allocation & Utilization
Track resource allocation across various departments and teams, ensuring optimal utilization and minimizing over or underuse of resources.
🛠 Budget & Cost Tracking
Keep an eye on the project budget with real-time data on expenses, ensuring you stay within budget limits and avoid costly overruns.
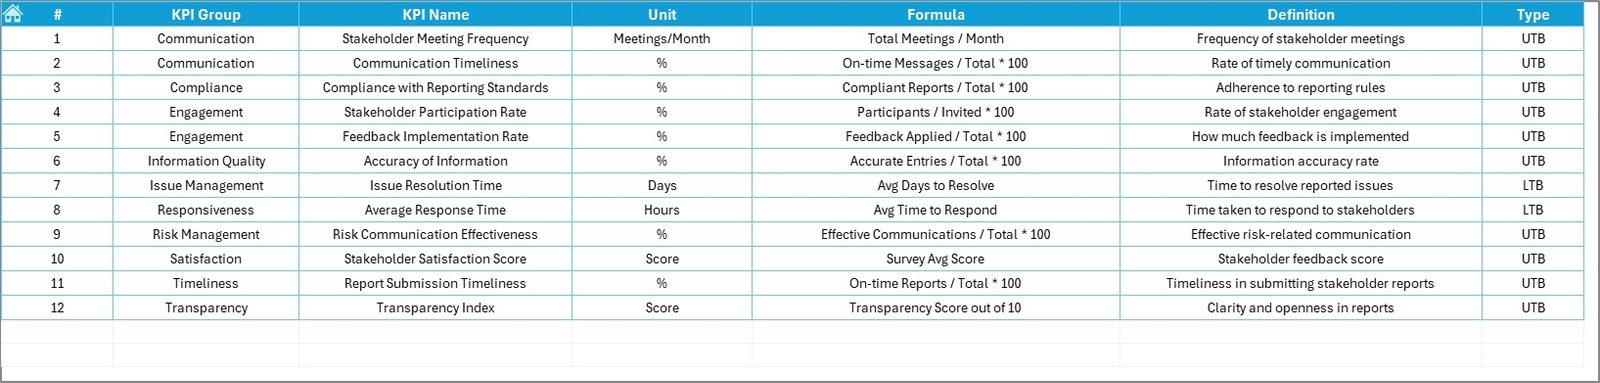
🔄 Customizable KPIs & Metrics
Easily customize the KPIs and metrics according to the specific needs of your project. Whether you need to track additional metrics or tailor the dashboard layout, this dashboard adapts to your needs.
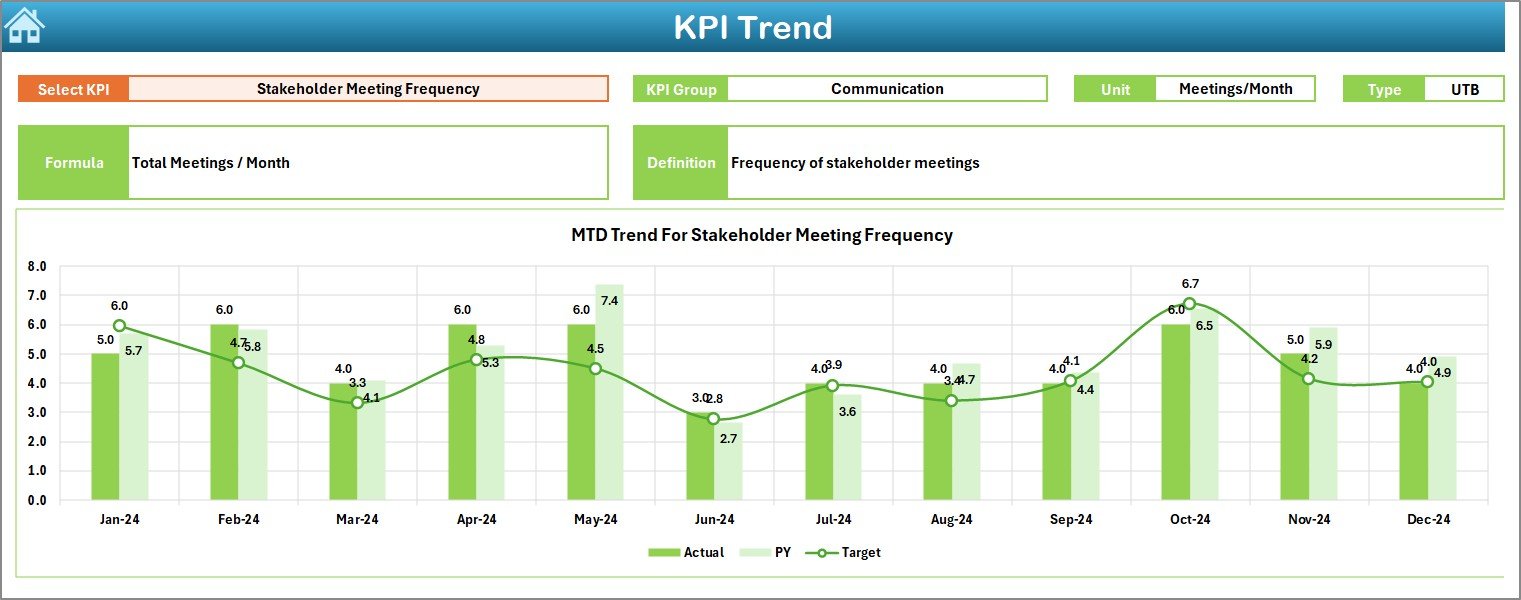
📅 Time-Based Reporting
Evaluate project performance over different time periods (daily, weekly, monthly) to monitor trends and identify areas for improvement.
⚙️ Easy-to-Use Excel Interface
With its intuitive layout, this dashboard is simple to use and does not require advanced Excel knowledge. The built-in formulas, charts, and tables provide a user-friendly experience.
Why You’ll Love the Project Management Stakeholder Reporting KPI Dashboard in Excel
✅ Streamlined Project Monitoring
Track all key project metrics in one place, making it easier to manage multiple projects or report to stakeholders with minimal effort.
✅ Keep Stakeholders Informed
Easily generate reports that summarize project performance, resource allocation, budget status, and more, ensuring stakeholders are always in the loop.
✅ Efficient Resource Management
Track the allocation and utilization of resources to optimize performance and ensure you’re getting the most out of your team and tools.
✅ Time-Saving
With automated updates and real-time performance tracking, save time on manual reporting and focus more on decision-making and project optimization.
✅ Customizable & Scalable
The dashboard can be tailored to suit your project’s specific KPIs, whether you’re working on a small project or a large-scale initiative.
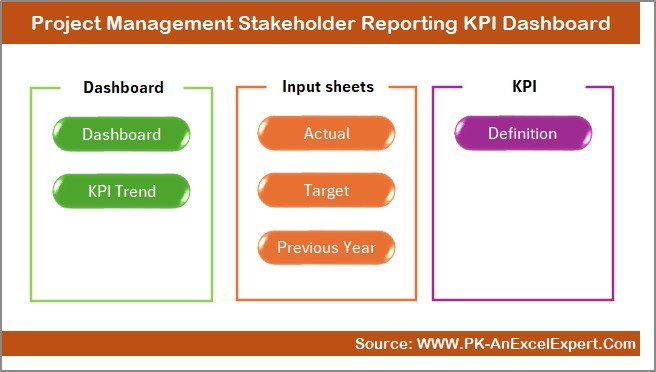
What’s Inside the Project Management Stakeholder Reporting KPI Dashboard in Excel?
-
Project Completion Tracking: Track the overall completion status of your project.
-
Budget Variance & Cost Tracking: Monitor project expenses and stay within budget limits.
-
Schedule Variance: Keep track of deviations from the original project schedule.
-
Resource Allocation & Utilization: Ensure that resources are being used effectively.
-
Stakeholder Reports: Generate customized reports for stakeholders to keep them updated.
-
Time-Based Performance Evaluation: Track project progress over time and spot any trends.
How to Use the Project Management Stakeholder Reporting KPI Dashboard in Excel
1️⃣ Download the Template: Gain instant access to the Excel-based dashboard.
2️⃣ Customize KPIs: Adjust the metrics and data sources to match your project’s needs.
3️⃣ Track Key Metrics: Input your project data to track key performance indicators.
4️⃣ Generate Reports: Use the dashboard’s automated reporting feature to generate stakeholder reports with just a click.
5️⃣ Analyze Performance: Review the data, spot trends, and make decisions based on real-time insights.
Who Can Benefit from the Project Management Stakeholder Reporting KPI Dashboard in Excel?
🔹 Project Managers & Project Management Teams
🔹 Stakeholders & Executives
🔹 Resource Managers & Teams
🔹 Business Analysts
🔹 IT & Operations Teams
🔹 Consulting Firms & Agencies
Ensure that your project is always on track, efficiently managed, and consistently reported with the Project Management Stakeholder Reporting KPI Dashboard in Excel.
Click here to read the Detailed blog post
Visit our YouTube channel to learn step-by-step video tutorials
Youtube.com/@PKAnExcelExpert


Reviews
There are no reviews yet.