


In a fast-moving product development environment, missing deadlines or misaligned KPIs can derail success. That’s why we created the Project Management Product Development KPI Dashboard in Excel — a plug-and-play Excel tool built to help teams stay laser-focused on delivery, cost, quality, and time-to-market.
This powerful and intuitive dashboard allows project managers and product teams to monitor KPIs, compare actuals with targets, and spot performance trends with just a few clicks. Whether you’re leading an Agile sprint or a multi-phase launch, this dashboard brings unmatched visibility and control — without requiring any fancy tools or licenses!
✨ Key Features of the Product Development KPI Dashboard
📋 7 Organized Worksheets
The dashboard includes the following tabs:
-
Home Sheet – A clickable index to quickly navigate between views
-
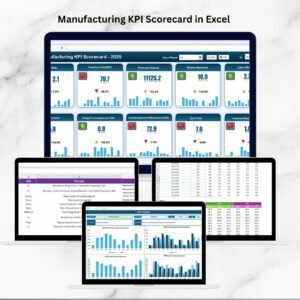
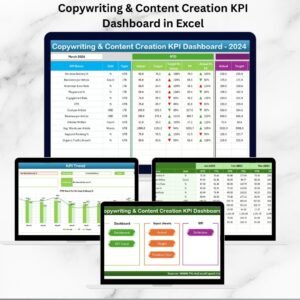
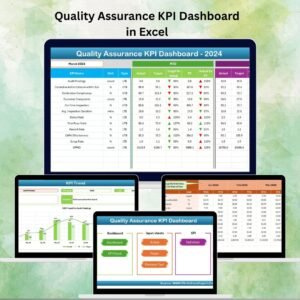
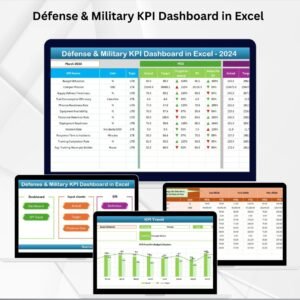
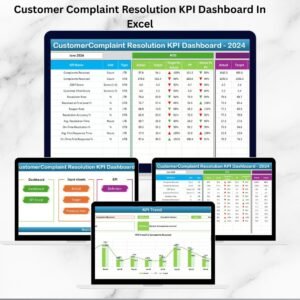
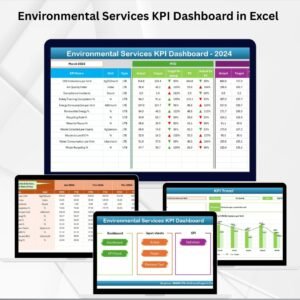
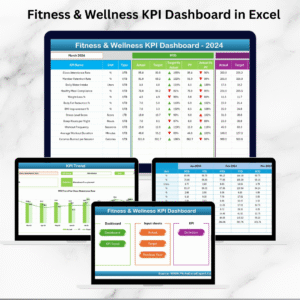
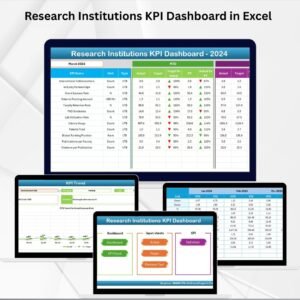
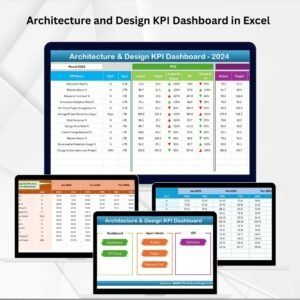
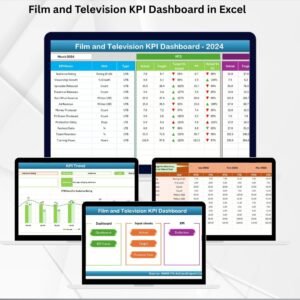
Dashboard Sheet – The core visual summary of KPIs
-
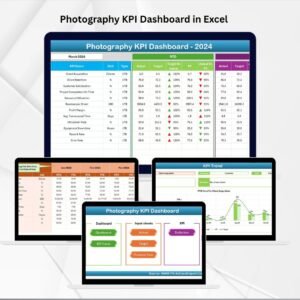
KPI Trend Sheet – Analyze each KPI’s monthly trends
-
Actual Numbers Input – Feed your monthly data here
-
Target Sheet – Input goal values for accurate comparisons
-
Previous Year Numbers – Store last year’s performance metrics
-
KPI Definition Sheet – See all KPI formulas, types, and definitions
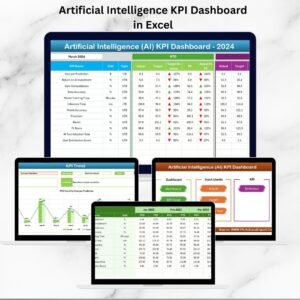
📊 Dashboard with Dropdown Control

Select a month from a simple dropdown in cell D3 and watch the entire dashboard update! Instantly see:
-
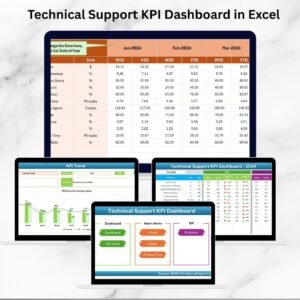
Month-to-Date (MTD) and Year-to-Date (YTD) performance
-
Conditional up/down arrows for trends
-
Target vs. Actual and Previous Year comparisons
📈 KPI Trend Analysis View
Dive deeper into individual KPI performance over time. Visualize metrics like development velocity, defect rate, or time-to-market across the year.
📁 Input-Ready Design
Data sheets are structured for easy entry — no complicated formulas to modify. Just plug in your monthly figures and go!
📦 What’s Inside the Product Development Dashboard?
🔹 Real-Time Dashboard Sheet – Your central hub for visual performance analysis
🔹 MTD vs. YTD Metrics – See real-time insights without any calculations
🔹 Historical Comparison – Built-in PY (Previous Year) view to monitor long-term trends
🔹 KPI Trend Charts – Visual representation of key development metrics
🔹 Dropdown-Driven Controls – Easily change months or select KPIs without touching formulas
🔹 Fully Editable Templates – Customize KPIs, formulas, or visuals to suit your workflow
🛠 How to Use the KPI Dashboard in Excel
-
Download and Open the Excel file
-
Navigate to the Actual Numbers Input sheet
-
Enter your monthly MTD and YTD data
-
Input your targets in the Target Sheet
-
Feed last year’s data in the Previous Year Numbers tab
-
Use the Dashboard and KPI Trend sheets to visualize performance
-
Refer to the KPI Definition Sheet to stay aligned with metrics and formulas
In just a few steps, you’ll be making data-driven decisions with confidence.
👥 Who Can Benefit from This Template?
This dashboard is ideal for professionals who oversee product development cycles:
🧑💼 Project Managers – Track KPIs like TTM, defect rate, and velocity
💡 Product Owners – Align releases with business objectives and deadlines
👩💻 Agile Teams – Monitor sprints, backlogs, and velocity in one place
🏢 Startup Teams – Keep your innovation KPIs in check
📊 Data Analysts – Visualize performance trends and share insights


Reviews
There are no reviews yet.