


The Agile Sprint KPI Dashboard in Excel is a powerful tool designed for Scrum Masters, Agile project managers, and development teams to track the performance and progress of Agile sprints. This Excel-based dashboard provides key performance indicators (KPIs) that allow you to monitor sprint progress, team performance, and work completion in real-time, ensuring that your Agile projects are running efficiently and on schedule.
With an intuitive interface, customizable charts, and easy-to-understand metrics, this dashboard helps Agile teams focus on key aspects such as sprint velocity, backlog health, and task completion, ensuring the success of your Agile process.
Key Features of the Agile Sprint KPI Dashboard in Excel:
📅 Sprint Progress Tracking
Monitor the overall progress of the current sprint, including work completed, work remaining, and the percentage of tasks completed.
🔄 Velocity Tracking
Track your team’s velocity (the amount of work completed in each sprint) to identify trends, predict future sprint performance, and adjust work estimates as needed.
🔧 Backlog Health Monitoring
Track the health of your sprint backlog, including the number of items completed, added, or carried over, helping you prioritize work effectively.
📊 Burndown Chart
Visualize progress with a burndown chart that shows how much work remains in the sprint, helping your team stay on track and meet sprint goals.
💡 Team Performance Monitoring
Track team member productivity, including story points completed and work item completion, helping you evaluate individual and team performance.
🚀 Why You’ll Love the Agile Sprint KPI Dashboard in Excel:

✅ Track Sprint Progress – Monitor the progress of your Agile sprints by tracking the work completed, work remaining, and velocity, ensuring your team stays on track.
✅ Measure Team Velocity – Track the velocity of your team’s performance to predict future sprint capacity and optimize sprint planning.
✅ Ensure Backlog Health – Monitor the health of your sprint backlog to ensure that work is prioritized, completed, and aligned with sprint goals.
✅ Visualize Sprint Progress – Use the burndown chart to visualize the amount of work left in the sprint, ensuring timely task completion.
✅ Optimize Team Performance – Track team performance with metrics such as completed story points and individual work completion.
✅ Customizable and Easy-to-Use – Fully customizable to fit your Agile team’s needs, with intuitive and easy-to-understand features.
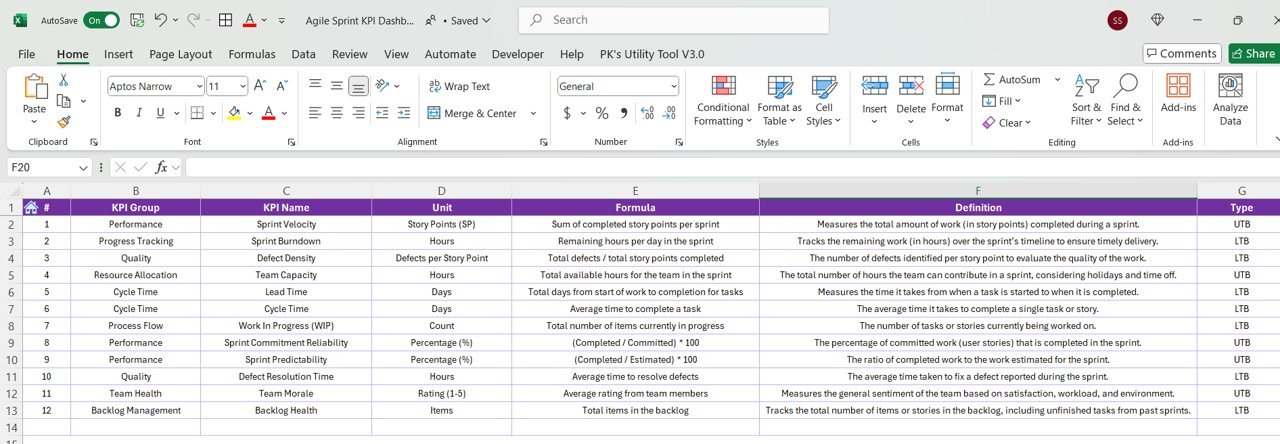
What’s Inside the Agile Sprint KPI Dashboard in Excel:
-
Sprint Progress Tracking: Monitor work completed and work remaining to ensure your team is on track to meet sprint goals and deadlines.
-
Velocity Tracking: Track team velocity to assess work capacity and predict future sprint performance.
-
Backlog Health: Track the status of backlog items, including completed, carried-over, or newly added work items, helping you manage the backlog effectively.
-
Burndown Chart: Visualize the sprint’s progress with a burndown chart, giving your team a clear view of the work remaining.
-
Team Performance: Track team member productivity and contribution to the sprint, helping identify areas for improvement.
-
Custom Reports: Generate custom reports that provide detailed insights into sprint performance, backlog health, and team progress.
How to Use the Agile Sprint KPI Dashboard in Excel:
1️⃣ Download the Template – Instantly access your Excel file upon purchase.
2️⃣ Input Sprint Data – Enter data for current and upcoming sprints, including work items, story points, and backlog information.
3️⃣ Monitor Sprint KPIs – Use the dashboard to track sprint progress, velocity, backlog health, and team performance in real-time.
4️⃣ Visualize Sprint Progress – Use the burndown chart and velocity tracking to visualize sprint progress and adjust plans accordingly.
5️⃣ Generate Reports – Create customized reports summarizing sprint performance, progress, and backlog health to share with stakeholders.
Who Can Benefit from the Agile Sprint KPI Dashboard in Excel:
-
Scrum Masters
-
Agile Project Managers
-
Development Teams
-
Product Owners
-
Agile Coaches
-
Project Management Offices (PMOs)
-
Small to Large Agile Teams
-
Enterprises implementing Agile Methodologies
The Agile Sprint KPI Dashboard in Excel is a must-have tool for Agile teams that want to track sprint performance, improve velocity, manage their backlog efficiently, and ensure that their projects are progressing as planned. By monitoring key Agile KPIs in real time, this dashboard helps your team achieve better outcomes and continuous improvement.
Click here to read the Detailed blog post
https://www.pk-anexcelexpert.com/agile-sprint-kpi-dashboard-in-excel/
Visit our YouTube channel to learn step-by-step video tutorials
Youtube.com/@PKAnExcelExpert


Reviews
There are no reviews yet.