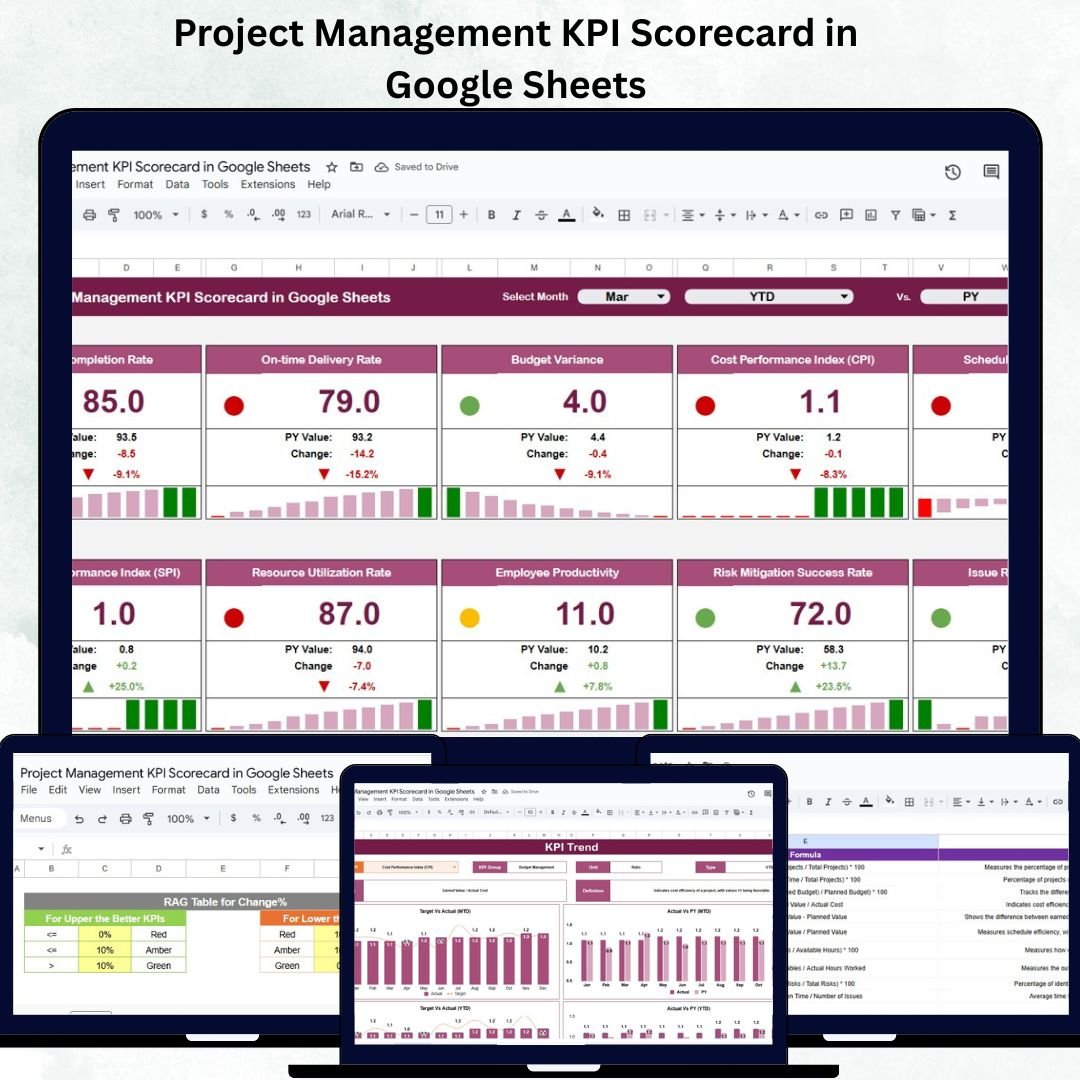
Tracking project success becomes effortless with the Project Management KPI Scorecard in Google Sheets — a fully interactive, data-driven tool designed to simplify how you measure, visualize, and report performance.
This professional template enables project managers, teams, and executives to monitor critical KPIs (Key Performance Indicators) like cost variance, schedule adherence, quality, and stakeholder satisfaction — all in one centralized dashboard. Built in Google Sheets, it combines automation, real-time collaboration, and visual scorecards to enhance decision-making and improve project outcomes.
🔑 Key Features of the Project Management KPI Scorecard in Google Sheets
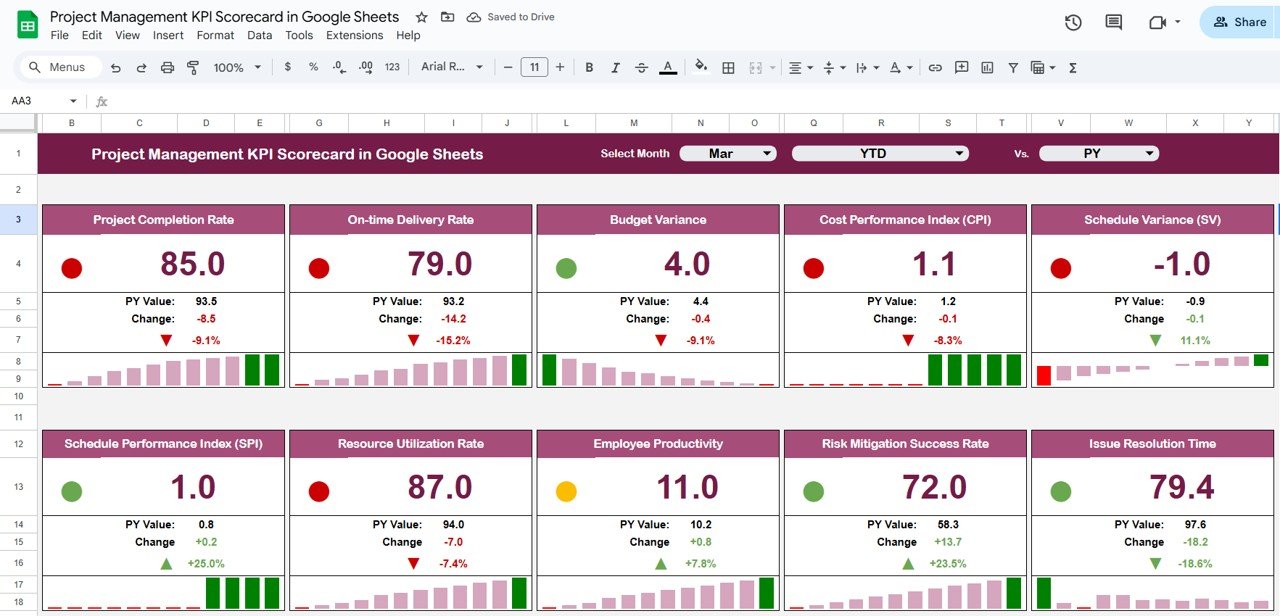
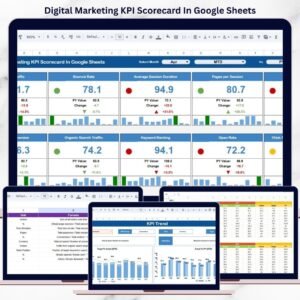
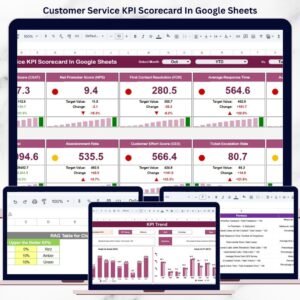
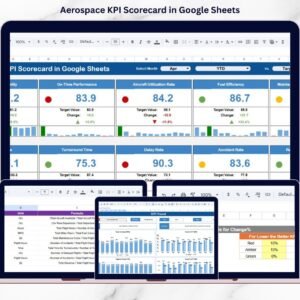
📊 1. Dashboard Sheet Tab
The Dashboard serves as the command center of your KPI tracking system.
Highlights:
-
Month Selector (Cell D3): Choose a month from the dropdown, and all KPI visuals update instantly.
-
10 Core KPIs: Displays metrics such as cost variance, project satisfaction, on-time completion, and quality adherence.
-
Traffic Light Indicators: Red, yellow, and green icons quickly show KPI status against targets.
-
Up/Down Arrows: Indicate progress direction (improvement or decline).
-
MTD/YTD Toggle: Instantly switch between Month-to-Date and Year-to-Date performance views.
This interactive view helps managers quickly identify problem areas and take corrective action — without needing advanced spreadsheet skills.
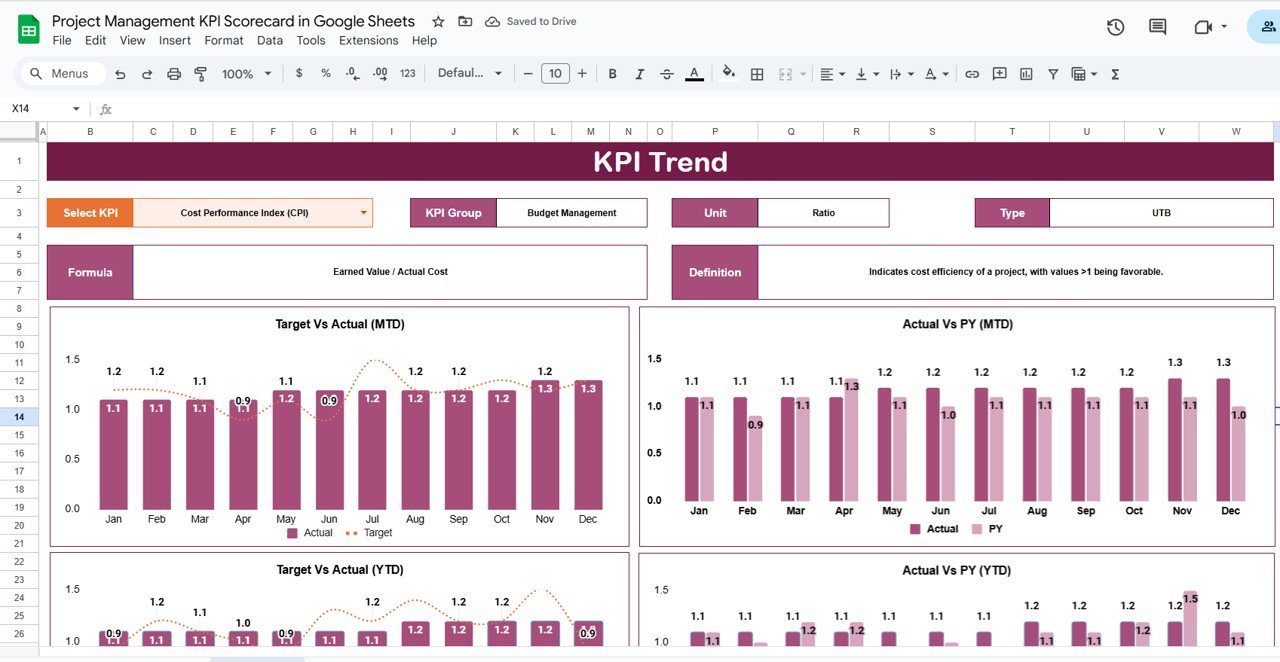
📈 2. KPI Trend Sheet Tab
The KPI Trend sheet allows long-term analysis and pattern recognition.
Features:
-
Select any KPI (dropdown in Cell C3) to view historical trends.
-
Displays KPI Group, Unit, Formula, and Type (UTB or LTB) for clarity.
-
Automatically generated trend charts display month-over-month performance.
Ideal for tracking consistency, identifying bottlenecks, and analyzing improvements across projects.
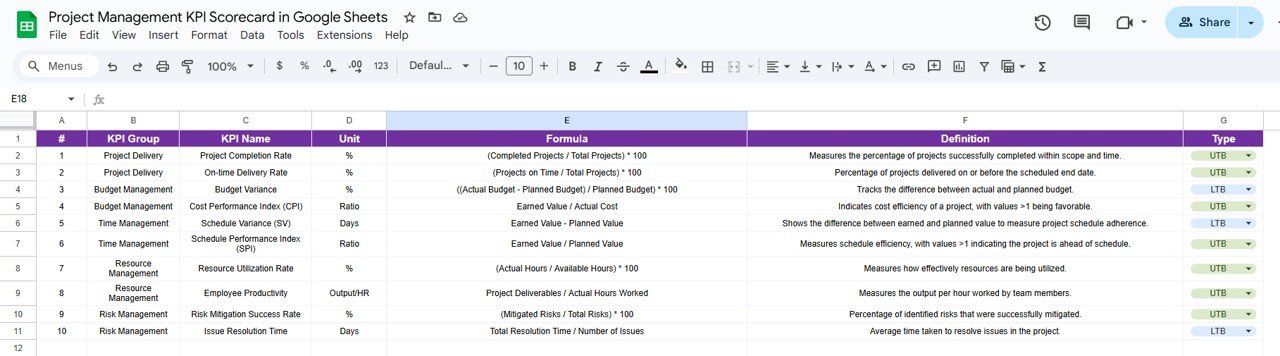
🧾 3. KPI Definition Sheet Tab
This sheet ensures your reporting remains standardized and transparent.
Columns Include:
-
KPI Name
-
KPI Group (Financial, Schedule, Quality, etc.)
-
Unit (% / $ / Count)
-
Formula
-
Definition
-
Type (UTB – Upper the Better / LTB – Lower the Better)
By clearly defining every KPI, your team ensures alignment on performance criteria and reporting accuracy.
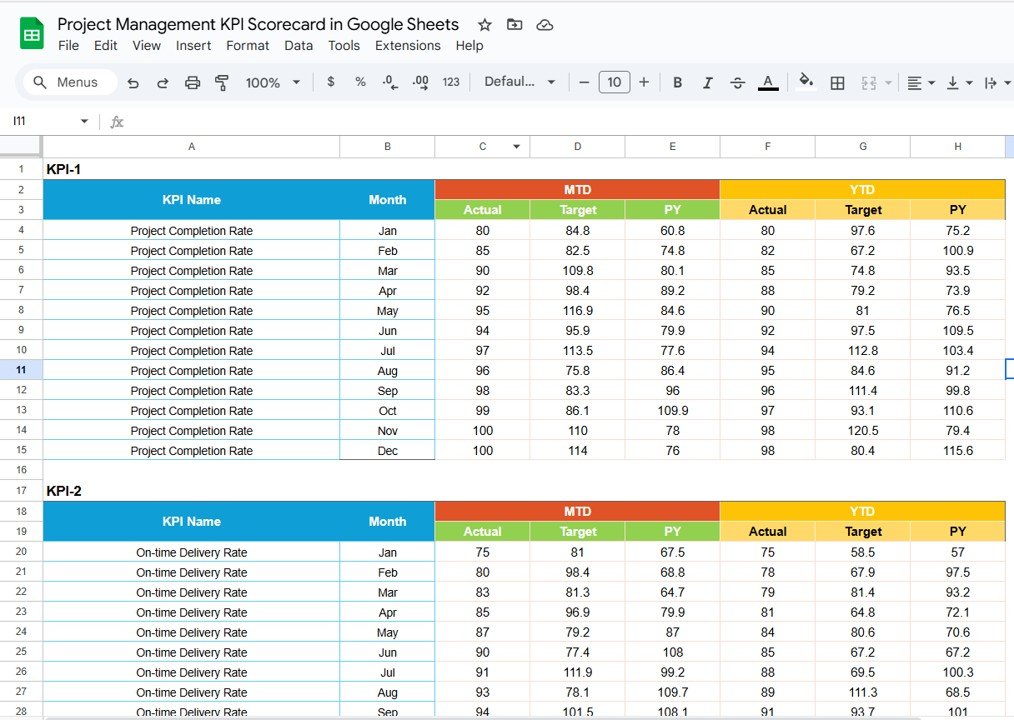
🧮 4. Data Input Sheet Tab
This sheet is the backbone of your scorecard.
Key Details:
-
Enter KPI data monthly — the dashboard auto-updates with formulas.
-
Manage multiple projects or teams effortlessly.
-
Data fields cover Actual, Target, Previous Year, and more.
It enables seamless, error-free data management and instant performance visualization.
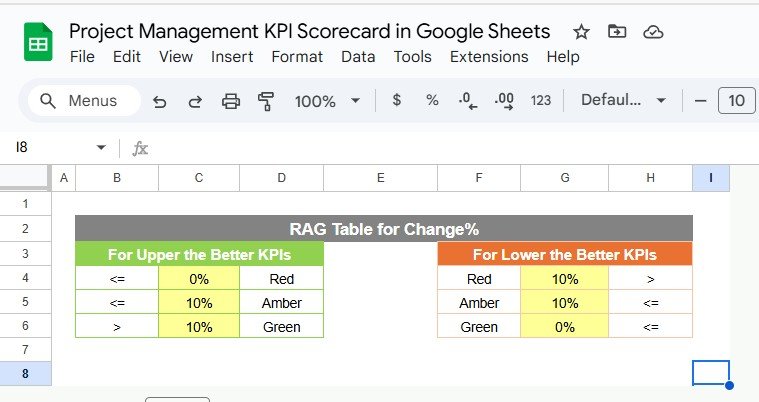
🎨 5. Color Settings Sheet Tab
Personalize how your dashboard looks and feels.
Customization Options:
-
Adjust thresholds for red, yellow, and green indicators.
-
Define up/down arrow parameters for trend analysis.
-
Apply color coding to match your organization’s branding.
This flexibility helps you align visuals with your company’s identity while maintaining clarity.
🌟 Advantages of Using the Project Management KPI Scorecard
-
📍 Centralized Performance View: All projects and KPIs in one sheet.
-
⚙️ Automated Analytics: Real-time updates when data changes.
-
🧭 Visual Clarity: Traffic lights and arrows simplify interpretation.
-
🤝 Collaborative Access: Multiple team members can edit simultaneously via Google Sheets.
-
📊 Consistent Metrics: KPI definitions ensure uniformity across reporting cycles.
-
🚀 Scalable Design: Expand to accommodate additional KPIs or projects easily.
💡 Best Practices
✅ Define Clear KPIs: Align each KPI with organizational or project objectives.
✅ Update Monthly: Keep performance reports fresh and actionable.
✅ Review Thresholds Regularly: Adjust colors or formulas as project priorities evolve.
✅ Monitor Trends: Use the Trend Sheet to identify recurring patterns or issues.
✅ Focus on Red Indicators: Prioritize problem areas for faster resolution.
✅ Customize for Teams: Add or remove KPIs to suit specific project portfolios.
👨💼 Who Can Use This Template
🏗️ Project Managers: Track success and progress in real time.
📈 PMOs & Executives: Evaluate multiple projects across teams or departments.
👩💻 Team Leads: Monitor accountability and task completion efficiency.
💼 Consultants: Showcase KPI-driven project reports for clients.
🚀 How This KPI Scorecard Improves Project Management
-
Enables data-driven decision-making by visualizing real-time performance.
-
Enhances team accountability through measurable KPIs.
-
Saves time by automating reporting and analysis.
-
Helps forecast performance trends for proactive planning.
-
Promotes strategic alignment between teams and leadership.
🔗 Click here to read the detailed blog post
Watch the step-by-step video Demo:


Reviews
There are no reviews yet.