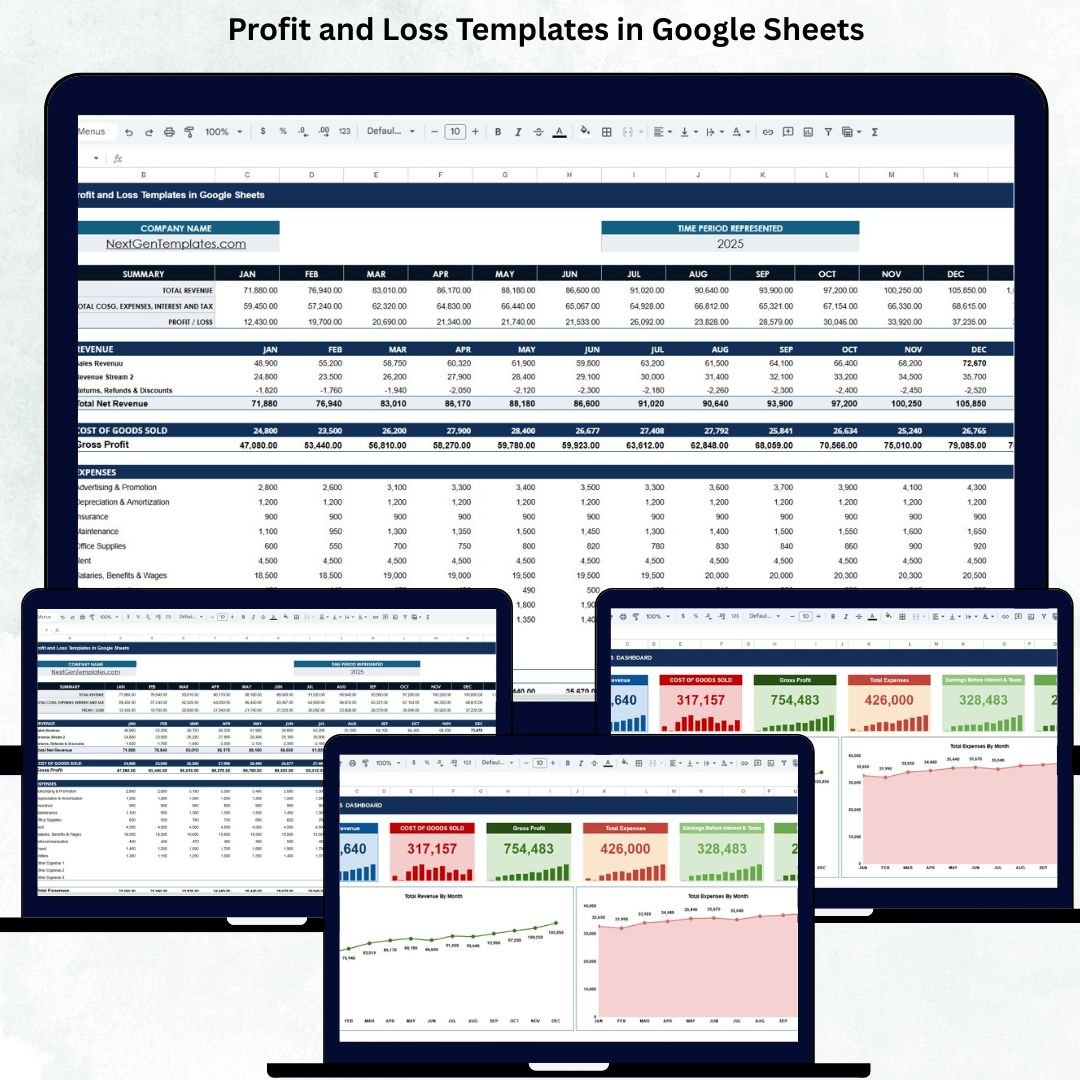
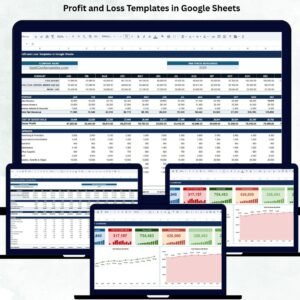
A Profit and Loss (P&L) Template in Google Sheets is one of the most essential tools for every business—whether you’re a startup founder, freelancer, shop owner, or finance professional. It provides a clear and organized view of your revenue, expenses, profit, and overall financial performance without complicated accounting software.Profit and Loss Templates in Google Sheets
This ready-to-use Google Sheets template helps you track financial results month by month and gives instant visibility into your business health. As soon as you update your monthly numbers, the template automatically calculates totals, generates key financial metrics, and updates your dashboard charts. This saves time, improves accuracy, and makes financial reporting simple for everyone.Profit and Loss Templates in Google Sheets
🌟 What This P&L Template Includes
This template comes with two powerful sheets:
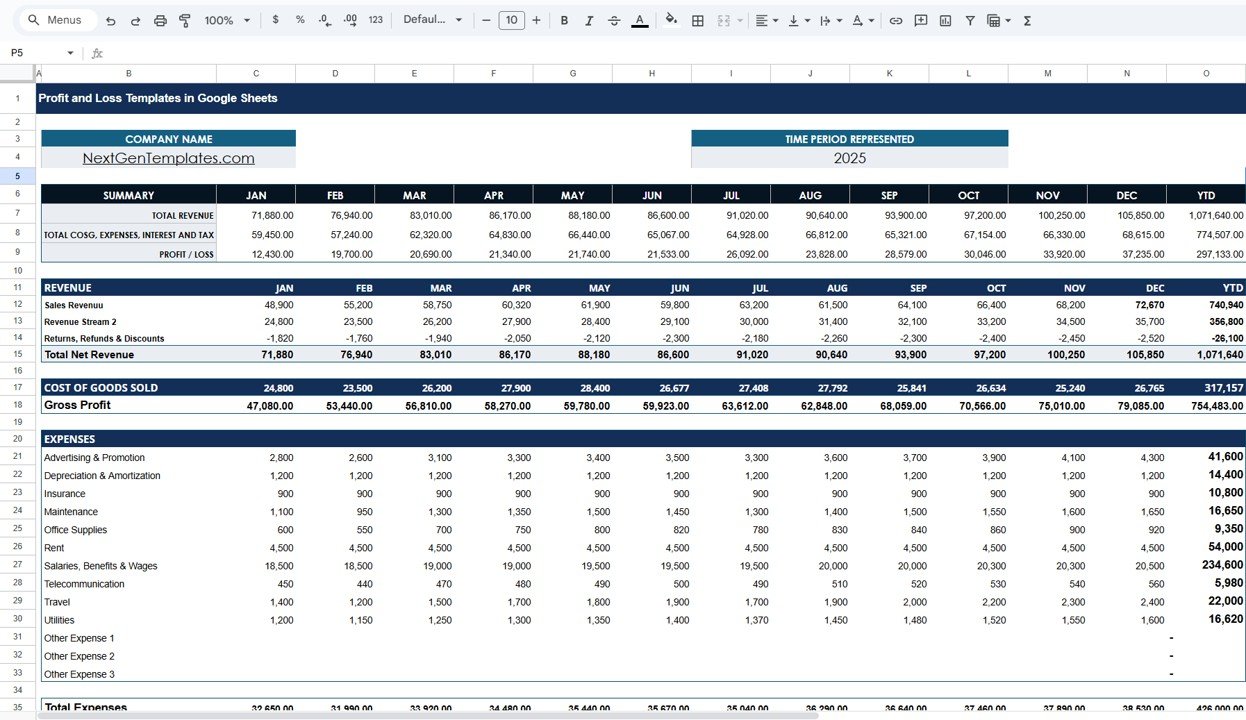
1️⃣ Template Sheet – Complete Financial Table
The Template Sheet organizes your financial data from January to December with automatic Year-to-Date (YTD) calculations. It includes:
-
Summary Section showing Total Revenue, Total COGS, Total Expenses, Taxes, and Profit/Loss.
-
Revenue Section including Sales Revenue, additional revenue streams, returns, refunds, and total net revenue.
-
COGS Section summarizing production and direct costs.
-
Expense Section covering advertising, salaries, utilities, office supplies, rent, travel, depreciation, and more.
-
Earnings Section showing EBIT, Interest, Profit Before Tax, Income Tax, and Net Profit.
All formulas are built-in so users do not have to calculate manually.
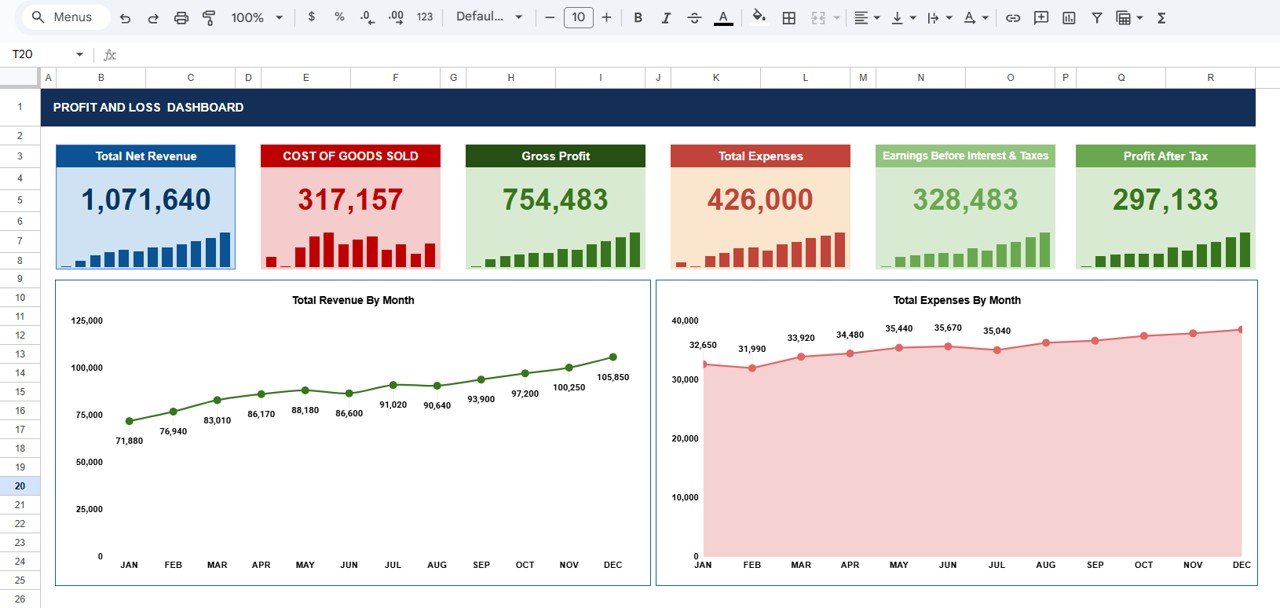
2️⃣ Dashboard Sheet – Visual Financial Insights
The Dashboard provides a clean, interactive, and real-time view of:
-
Total Net Revenue
-
Cost of Goods Sold (COGS)
-
Gross Profit
-
Total Expenses
-
EBIT
-
Profit After Tax
It also includes two key charts:
📌 Total Revenue by Month – Track revenue patterns, peaks, slow periods, and overall growth.
📌 Total Expenses by Month – Identify spending trends, cost spikes, and budget performance.
These visuals make it easier to present financial insights to management, investors, and teams.
✨ Key Advantages
-
Simple and user-friendly — perfect for beginners and professionals.
-
Automatically calculates all totals — no manual formulas needed.
-
Highly customizable — add more revenue or expense categories.
-
Helps identify profitability trends across the year.
-
Improves strategic planning with month-by-month analysis.
-
Supports team collaboration through Google Sheets’ sharing features.
🚀 Opportunities for Enhancement
You can extend this template with advanced features like:
-
Department-wise P&L reports
-
Forecasting and projection models
-
Automated alerts for unusual profit dips
-
Year-over-Year comparison charts
This makes your template even more powerful for decision-making.
📘 Best Practices for Using This Template
-
Update your revenue & expenses every month.
-
Keep naming consistency across all expense categories.
-
Review Gross Profit monthly to track cost efficiency.
-
Use charts during reviews for clearer discussions.
-
Compare Revenue vs Expenses regularly to maintain balance.
Click here to read the Detailed blog post
Watch the step-by-step video tutorial:


Reviews
There are no reviews yet.