
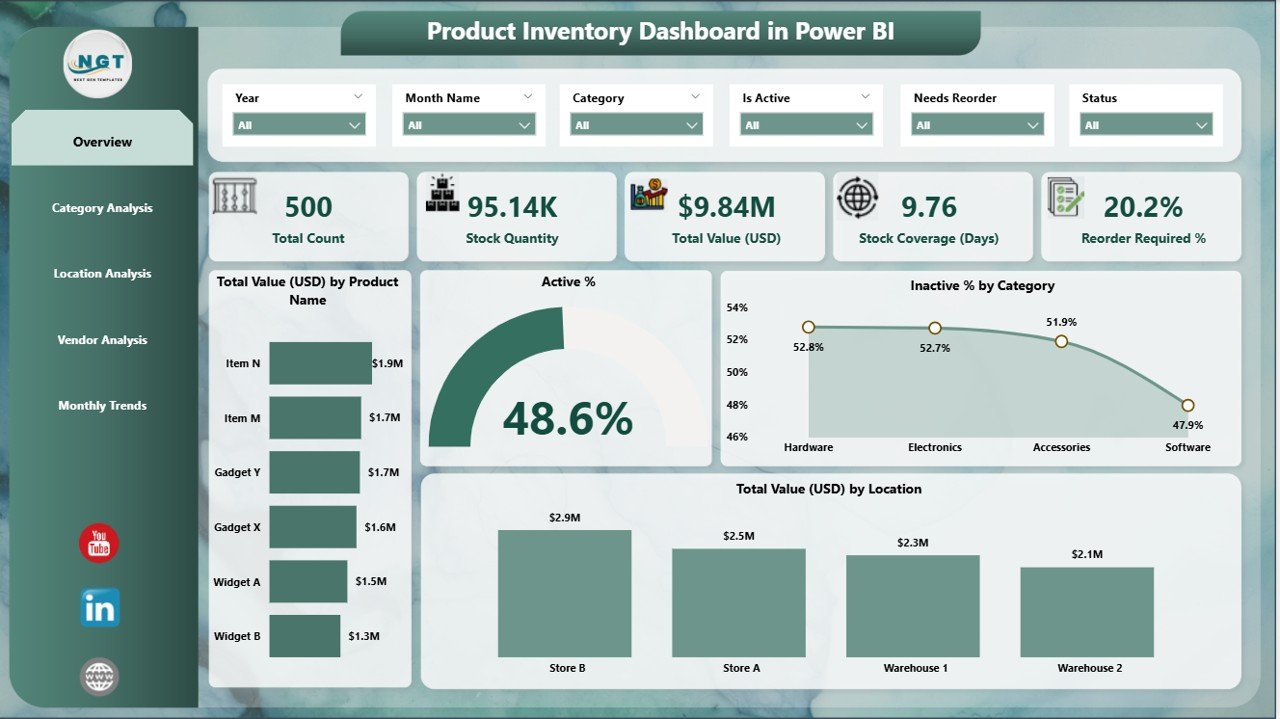
Managing product inventory has never been easier! Stockouts cause lost sales, while overstocking locks up working capital. That’s why our Product Inventory Dashboard in Power BI is designed to help businesses strike the perfect balance between demand and supply. With this ready-to-use solution, you can connect your Excel data, visualize it instantly, and gain insights that drive smarter decisions.
This dashboard transforms raw inventory data into interactive visuals so you can monitor product performance across categories, vendors, and locations in real time. No more manual reporting or endless spreadsheets — everything you need is consolidated into one dynamic, easy-to-use dashboard.
🔑 Key Features of Product Inventory Dashboard in Power BI
✨ Real-Time Insights – Monitor stock health instantly with auto-updated visuals.
✨ Multi-Perspective Analysis – Track inventory by category, vendor, location, and monthly trends.
✨ Interactive KPIs – View total value, active %, inactive %, reorder %, and stock coverage days.
✨ Drill-Down Capability – Identify problem areas by filtering and slicing data.
✨ Excel-Friendly Input – Built on Excel data, no coding expertise required.
✨ Mobile-Ready – Access insights anytime, anywhere via Power BI mobile app.
📦 What’s Inside the Product Inventory Dashboard
When you purchase this template, you’ll get a fully structured dashboard with five dedicated pages, each serving a unique purpose:
1️⃣ Overview Page – Quick snapshot of inventory health with KPIs and high-level charts.
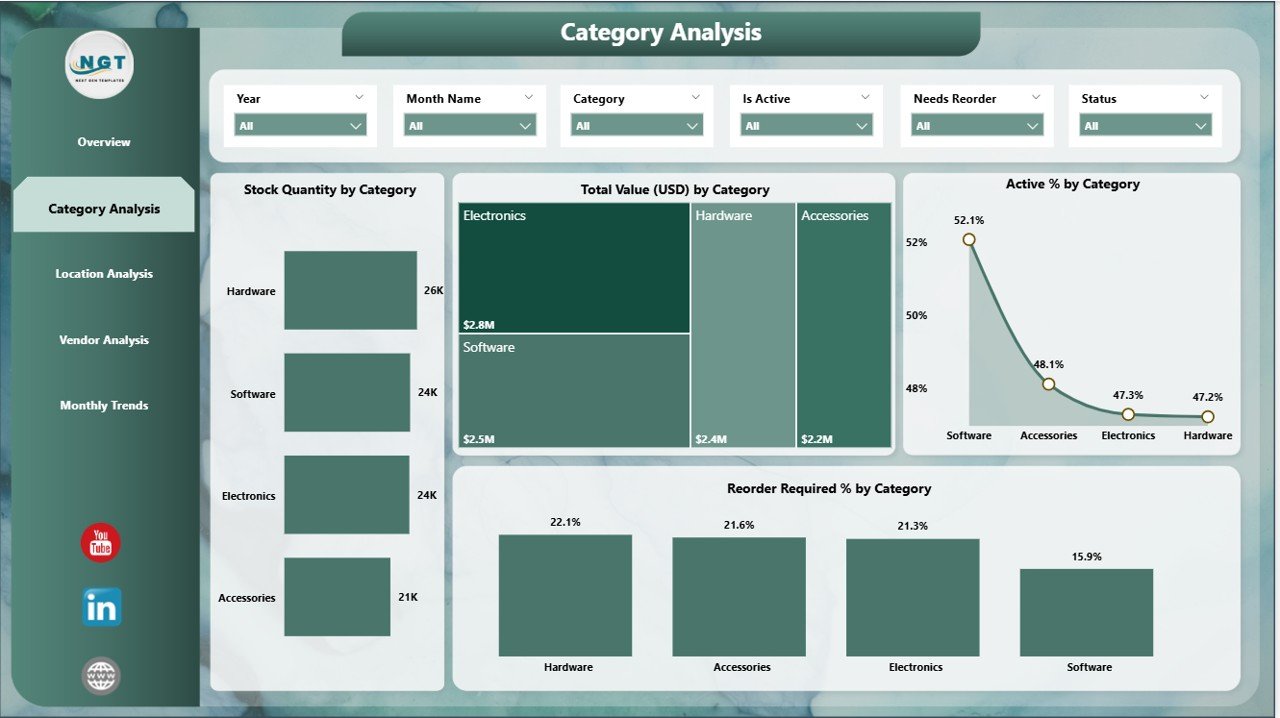
2️⃣ Category Analysis – Track stock levels, reorder percentages, and performance by product category.
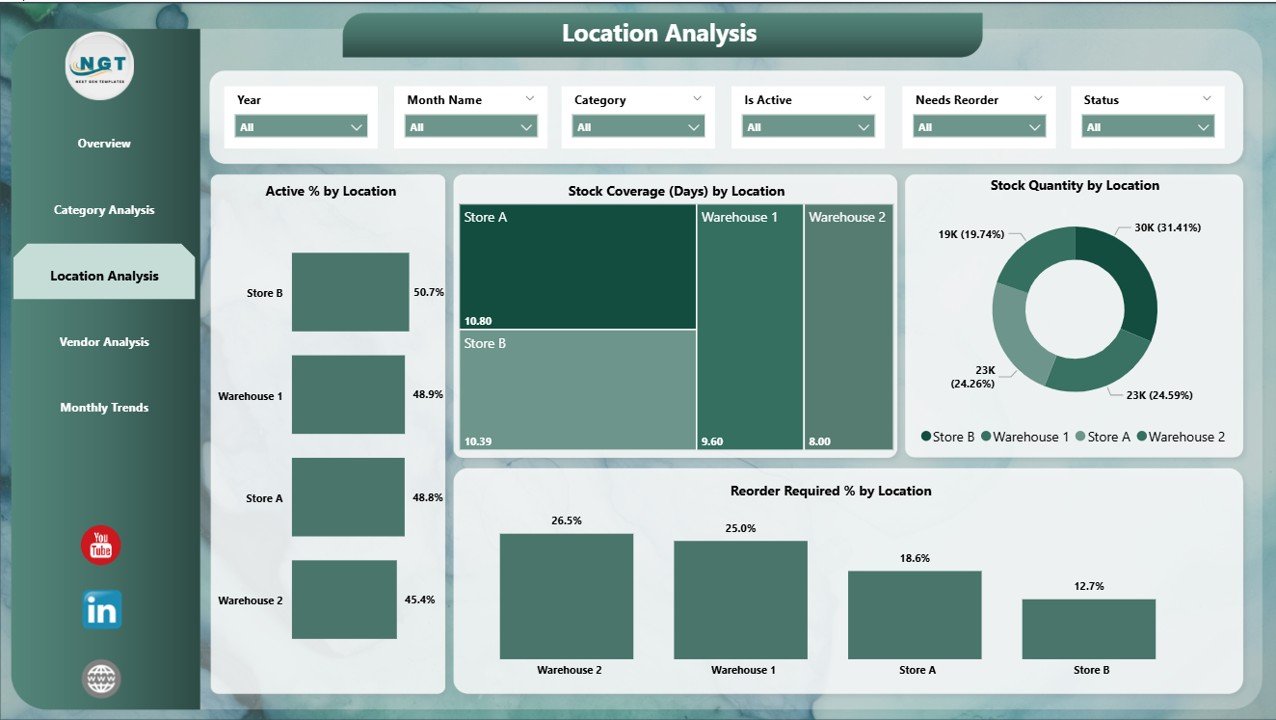
3️⃣ Location Analysis – Analyze stock distribution, warehouse coverage, and efficiency across sites.
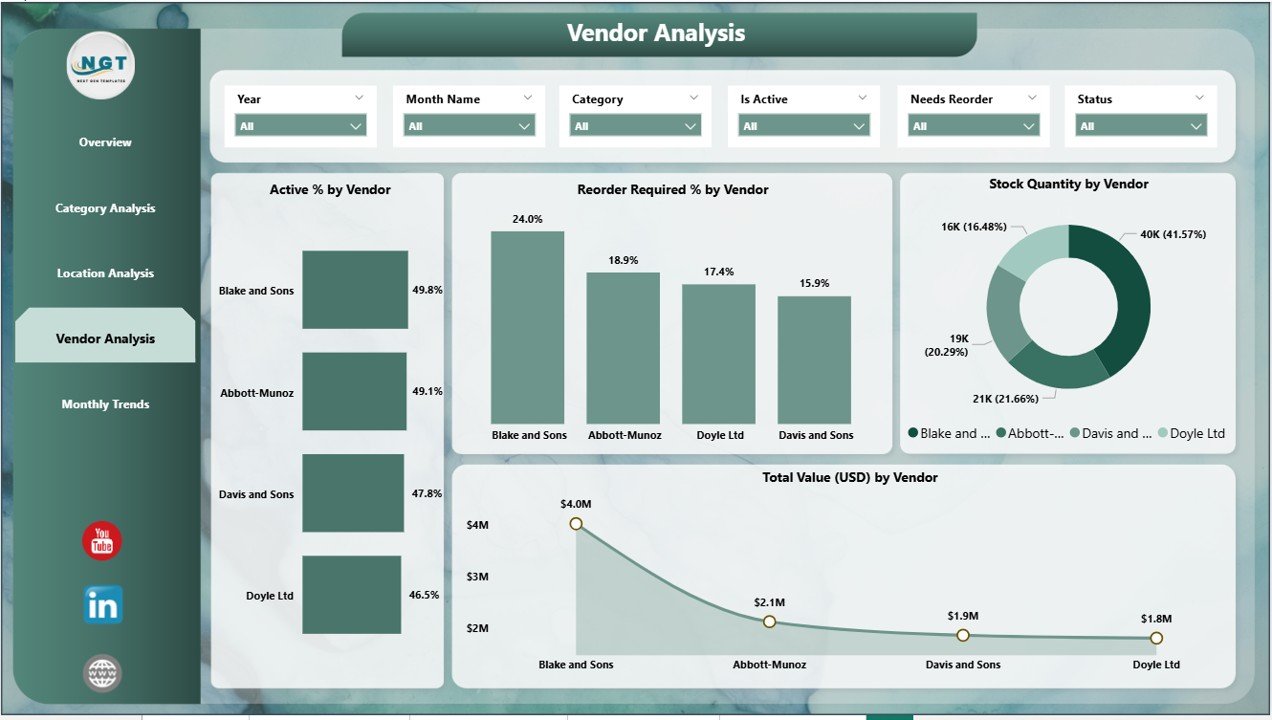
4️⃣ Vendor Analysis – Evaluate supplier reliability, reorder needs, and stock value by vendor.
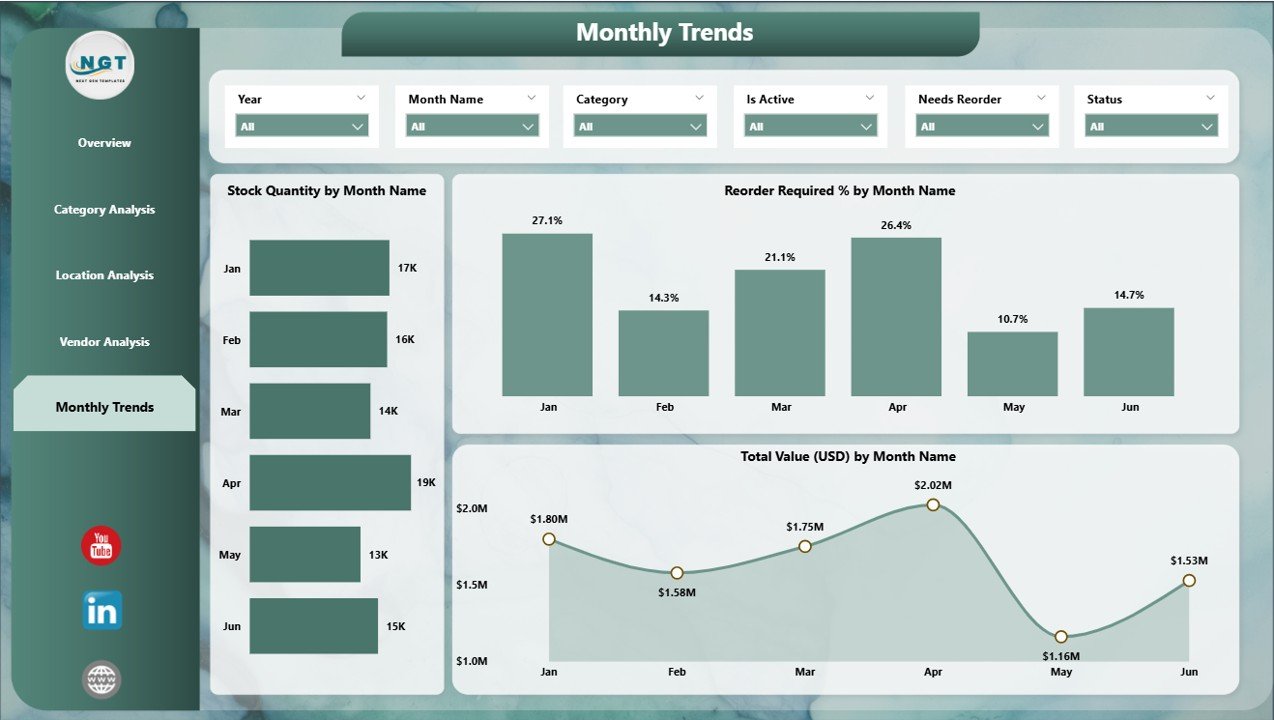
5️⃣ Monthly Trends – Forecast demand and monitor seasonal changes with time-based insights.
Each page is designed with executives, managers, and analysts in mind — making sure everyone gets the right view for better decisions.
🛠️ How to Use the Product Inventory Dashboard
✔️ Step 1 – Prepare Your Data: Maintain your product inventory in Excel (fields like Product Name, Category, Vendor, Location, Quantity, Value, etc.).
✔️ Step 2 – Load into Power BI: Import your Excel file and connect it to the dashboard.
✔️ Step 3 – Refresh & Analyze: Use Power BI’s refresh option to update dashboards automatically.
✔️ Step 4 – Apply Filters: Slice data by category, location, vendor, or time to drill into specific details.
✔️ Step 5 – Share & Collaborate: Publish to Power BI Service and allow your team to access it across devices.
No technical skills required — simply plug in your data, and you’re ready to go!
👥 Who Can Benefit from This Product
💼 Business Owners – Get a bird’s-eye view of your company’s stock health.
📦 Inventory Managers – Track reorder needs, optimize warehouse usage, and reduce carrying costs.
🛒 Procurement Teams – Evaluate vendor performance and negotiate better deals.
📊 Finance Teams – Monitor cost efficiency by identifying inactive products and reducing wastage.
📍 Multi-Location Businesses – Compare warehouse stock coverage and plan logistics better.
📈 Small & Large Enterprises – Whether you run a small business or a global enterprise, this dashboard adapts to your needs.
Click here to read the Detailed blog post
Visit our YouTube channel to learn step-by-step video tutorials 👉 Youtube.com/@PKAnExcelExpert


Reviews
There are no reviews yet.