

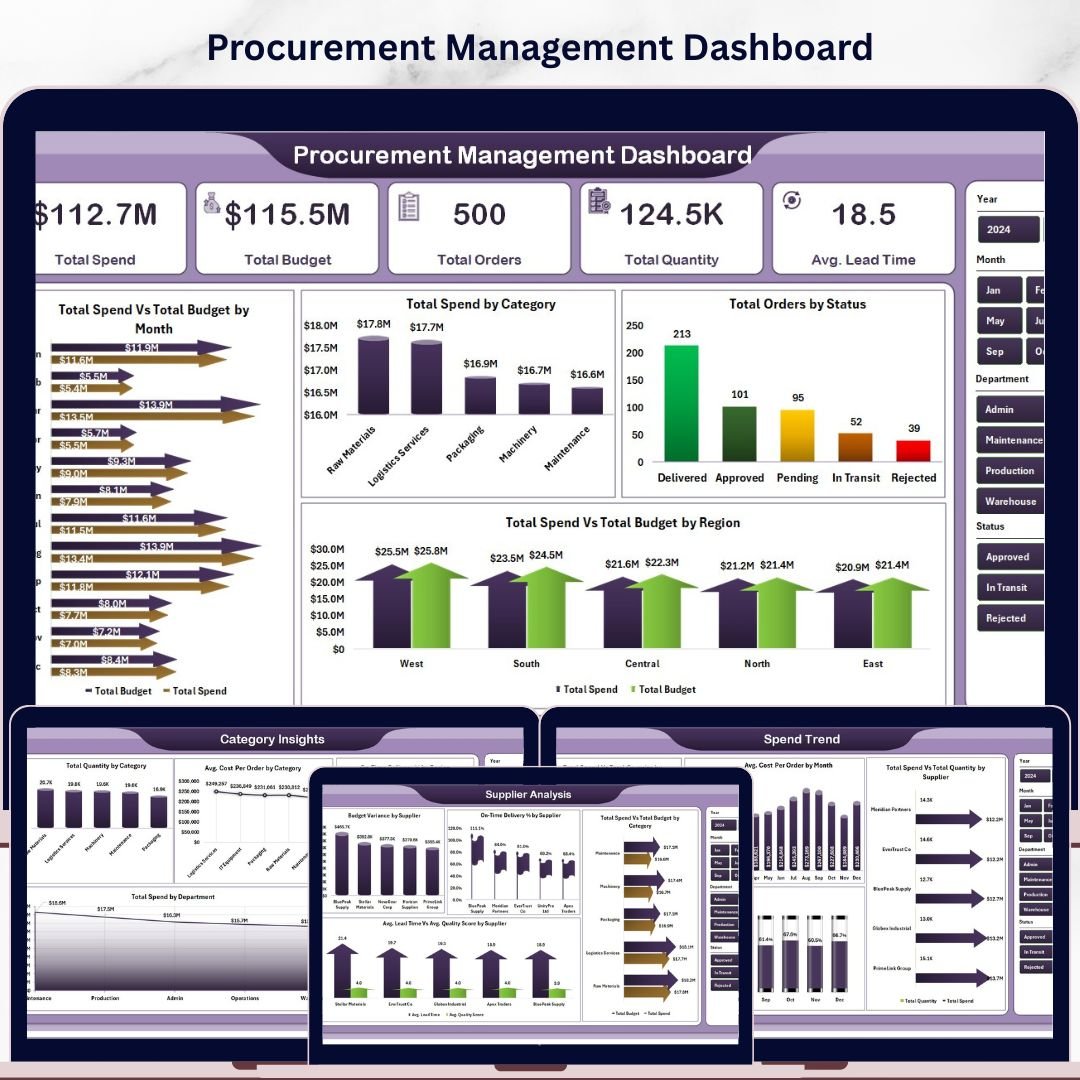

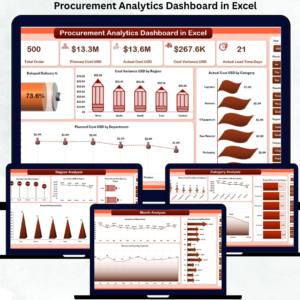
Procurement Management Dashboard in Excel is a comprehensive, ready-to-use Excel dashboard designed for procurement professionals, supply chain managers, and operations teams who need to track procurement spending, supplier performance, order status, and budget compliance — all from a single interactive workbook. This powerful template includes 5 dynamic dashboard pages, a structured data sheet, and a support sheet with pivot tables that auto-refresh with one click 📊🛒.
Managing procurement operations without centralized visibility leads to budget overruns, missed delivery deadlines, and supplier quality issues. The Procurement Management Dashboard in Excel eliminates these blind spots by transforming your raw procurement data into clear, actionable charts, KPI cards, and filterable analytics. This dashboard includes 5 interactive pages and tracks 5 key performance indicators including Total Spend, Total Budget, Total Orders, Total Quantity, and Avg. Lead Time.
 Procurement Management Dashboard
🔑 Key Features of Procurement Management Dashboard in Excel
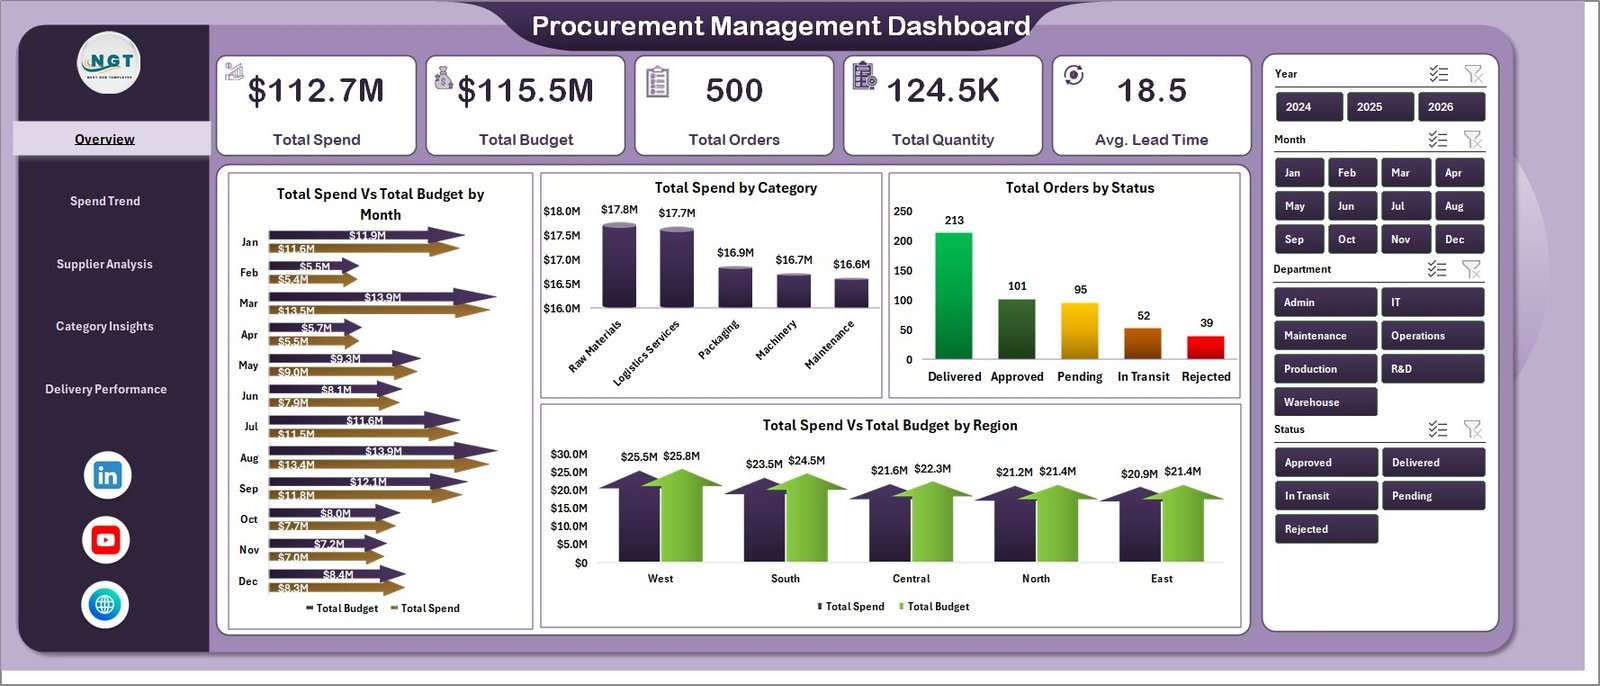
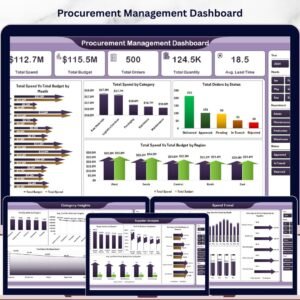
This Excel dashboard delivers complete procurement visibility across 5 interactive pages with dynamic charts and slicers. The Overview page displays 5 KPI cards — Total Spend, Total Budget, Total Orders, Total Quantity, and Avg. Lead Time — alongside 4 analytical charts covering spend vs budget trends, category breakdowns, order status distribution, and regional budget comparisons. Built-in slicers enable instant filtering across all pages, allowing managers to drill down into specific suppliers, categories, regions, or time periods within seconds.
The template uses pivot-powered dynamic charts that auto-refresh when you update the data sheet. No VBA or macros are required — everything runs on standard Excel formulas and pivot tables. The Spend Trend page tracks spending patterns over time with year-over-year comparisons and budget compliance analysis. The Supplier Analysis page evaluates vendor performance through budget variance, on-time delivery rates, and quality scores. The Category Insights page breaks down procurement metrics by product category and department. The Delivery Performance page monitors lead times by buyer and spending by payment terms.
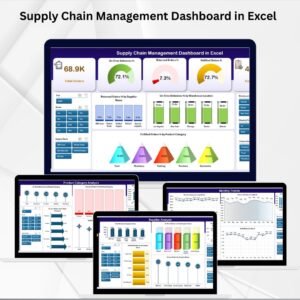
If you are looking for more Excel Dashboard Templates, explore our extensive collection designed for various industries and departments. For supply chain management specifically, check out our Supply Chain Dashboard in Excel and the Vendor Performance Dashboard in HTML for complementary analytics.
📦 What’s Inside the Procurement Management Dashboard
📄 Overview Page — Executive-level snapshot with KPI cards for Total Spend, Total Budget, Total Orders, Total Quantity, and Avg. Lead Time. Four charts analyze Total Spend Vs Total Budget by Month, Total Spend by Category, Total Orders by Status, and Total Spend Vs Budget by Region. Multiple slicers enable instant filtering to quickly view specific subsets of procurement data.
📄 Spend Trend Page — Deep spending analysis with charts for Total Spend Vs Total Quantity by Year, Avg. Cost Per Order by Month, Total Spend Vs Total Quantity by Supplier, and Within Budget % by Month. This page helps procurement managers identify spending patterns and supplier cost trends over time.
 Spend Trend Page
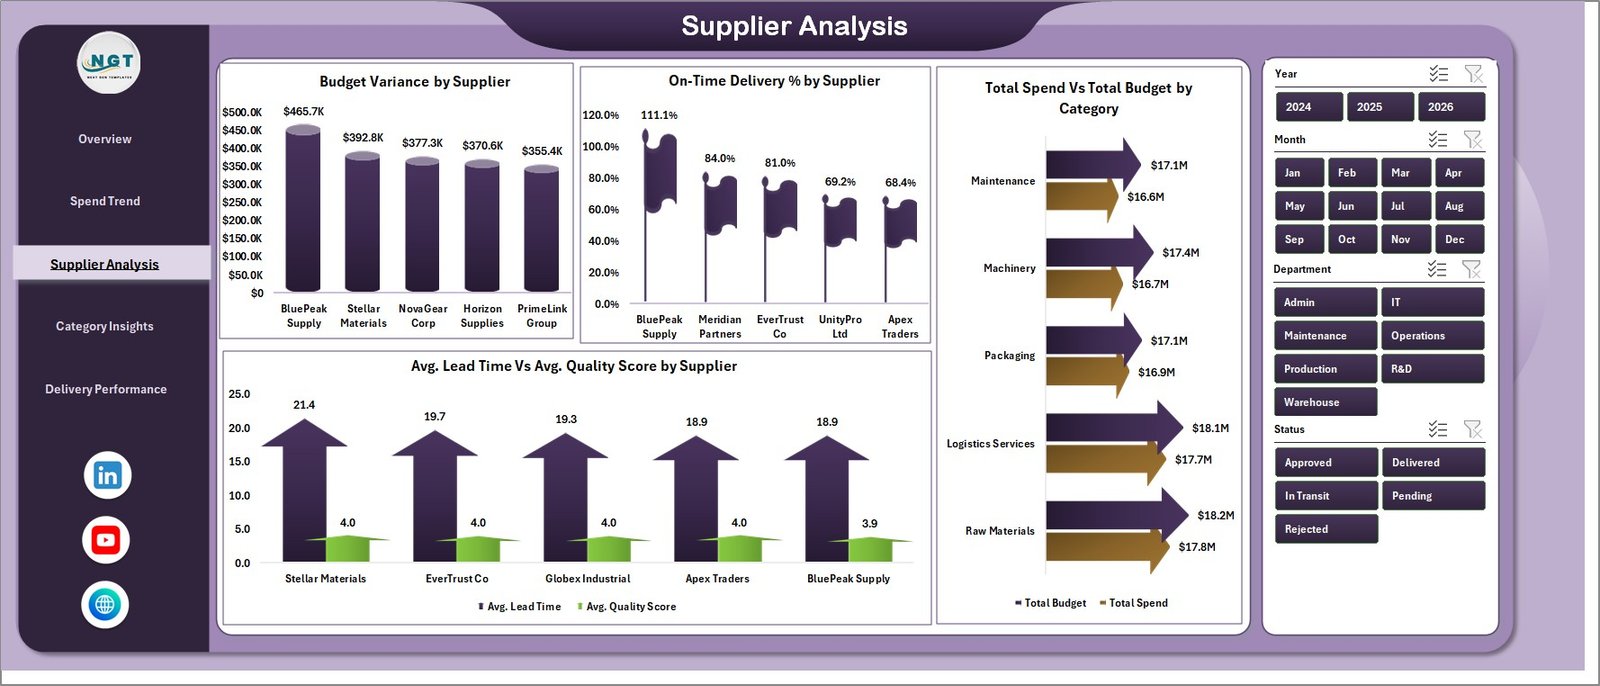
📄 Supplier Analysis Page — Evaluate vendor performance with Budget Variance by Supplier, On-Time Delivery % by Supplier, Total Spend Vs Total Budget by Category, and Avg. Lead Time Vs Avg. Quality Score by Supplier. This page is essential for supplier evaluation and strategic sourcing decisions.
 Supplier Analysis Page
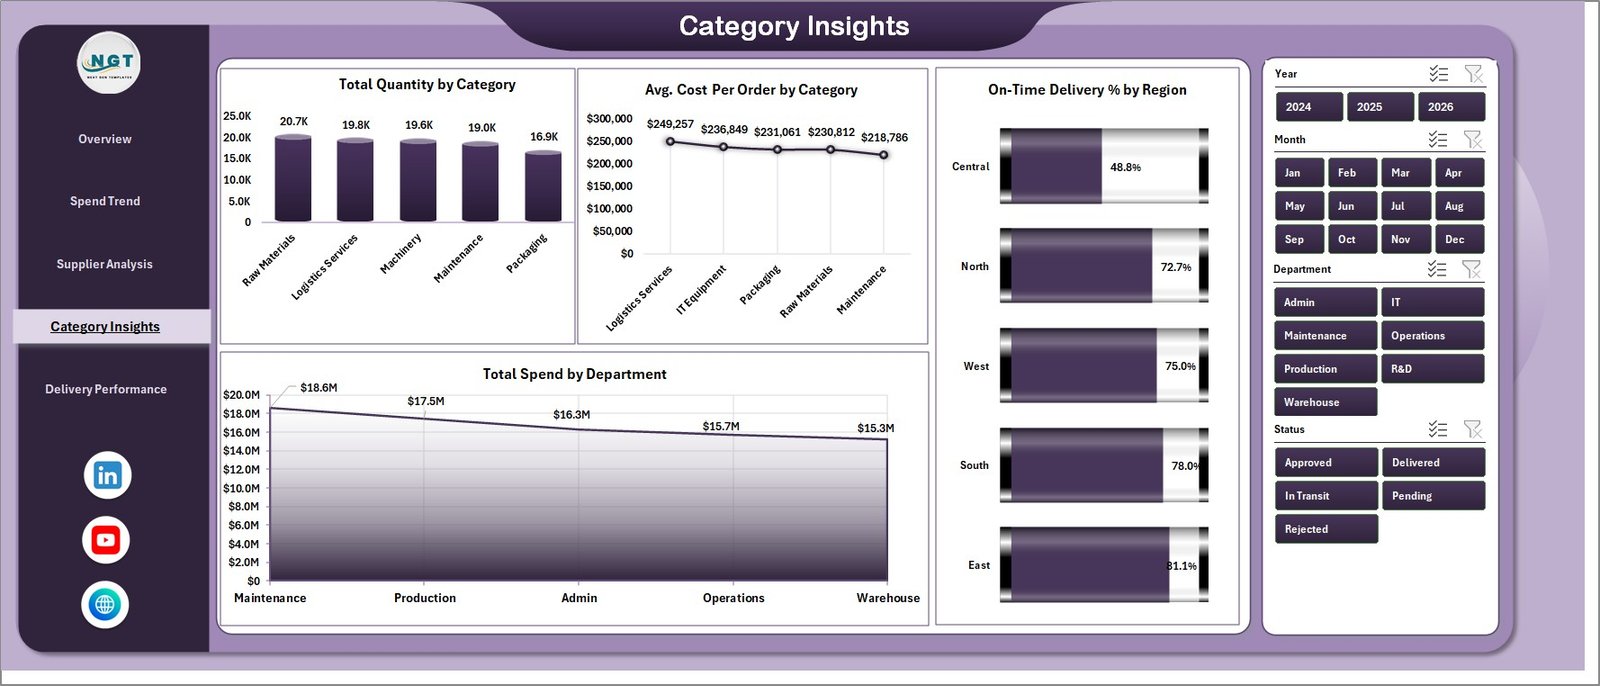
📄 Category Insights Page — Category-level analysis with Total Quantity by Category, Avg. Cost Per Order by Category, On-Time Delivery % by Region, and Total Spend by Department. Helps procurement teams identify high-spend categories and optimize purchasing decisions.
 Category Insights Page
📄 Delivery Performance Page — Monitor delivery efficiency with Avg. Lead Time by Buyer, Total Spend Vs Total Orders by Status, and Total Spend by Payment Terms. This page helps identify bottlenecks in procurement delivery cycles and optimize payment strategies.
 Delivery Performance Page
📄 Data Sheet — Enter your procurement records here in the same format as the sample data. The dashboard auto-updates when you refresh pivot tables.
 Data Sheet Tab
📄 Support Sheet — Contains all the pivot tables that power the dashboard dynamically. After updating data, go to the Data tab in the Excel Ribbon and click Refresh All — all pivots and charts will update automatically. You can keep this sheet hidden.
 Support Sheet Tab
⚙️ How to Use the Procurement Management Dashboard
1️⃣ Download and open the file in Microsoft Excel (2016 or later recommended).
2️⃣ Go to the Data Sheet tab and replace the sample data with your actual procurement records — maintain the same column structure.
3️⃣ Navigate to the Data tab in the Excel Ribbon and click “Refresh All” to update all pivot tables and charts.
4️⃣ Use the slicers on each dashboard page to filter data by category, region, supplier, status, or time period.
5️⃣ Review each dashboard page for procurement insights — Overview for KPIs, Spend Trend for cost patterns, Supplier Analysis for vendor evaluation, Category Insights for spend breakdown, and Delivery Performance for lead time tracking.
👥 Who Can Benefit from This Procurement Management Dashboard
📌 Procurement Managers and Officers who need to monitor spending, supplier performance, and budget compliance across categories and regions.
📌 Supply Chain Directors and VPs who require executive-level procurement analytics for strategic decision-making and vendor negotiations.
📌 Finance Teams and Controllers who track procurement budgets, cost variances, and payment terms across departments.
📌 Operations Managers who need visibility into order status, lead times, and delivery performance to optimize operational workflows.
📌 Small Business Owners who want a centralized dashboard to manage purchasing activities without expensive procurement software.
📌 Consultants and Analysts who create procurement reports and presentations for clients across industries.
❓ Frequently Asked Questions
What is the best Excel template for tracking procurement management?
The Procurement Management Dashboard in Excel from NextGenTemplates is a ready-to-use template that tracks 5 KPIs including Total Spend, Total Budget, Total Orders, Total Quantity, and Avg. Lead Time across 5 interactive dashboard pages with dynamic charts and slicers.
How do I track procurement spend vs budget in Excel?
This dashboard includes dedicated charts for Total Spend Vs Total Budget by Month and Total Spend Vs Budget by Region on the Overview page, plus Within Budget % by Month on the Spend Trend page. Simply enter your procurement data and refresh to see instant budget compliance analysis.
Do I need VBA or macros to use this procurement dashboard?
No. The Procurement Management Dashboard in Excel is 100% formula and pivot-table based. No VBA or macros are needed. It works in Microsoft Excel 2016 and later versions without enabling macros.
How does this dashboard help evaluate supplier performance?
The Supplier Analysis page tracks Budget Variance by Supplier, On-Time Delivery % by Supplier, and Avg. Lead Time Vs Avg. Quality Score by Supplier. These metrics help procurement teams make data-driven decisions about vendor selection and contract negotiations.
Can I customize this procurement dashboard for my business?
Yes. The dashboard is fully unlocked and editable. You can modify charts, add new KPIs, change color themes, adjust slicer options, and connect it to your own data structure. All pivot tables and formulas are accessible for customization.
What data fields are required for this procurement dashboard?
The Data Sheet includes fields for order details, supplier information, category, region, department, budget amounts, actual spend, quantity, lead time, quality score, delivery status, payment terms, and buyer name. A sample dataset with 500 records is pre-loaded for reference.
🔗 Explore Related Templates
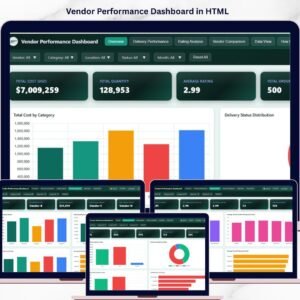
🔹 Vendor Performance Dashboard in HTML — Interactive HTML dashboard for monitoring vendor delivery, quality, and cost performance with 5 analytical pages.
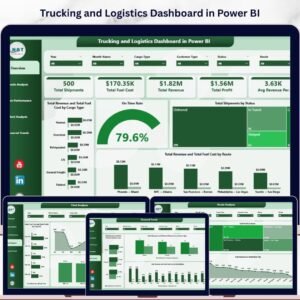
🔹 Trucking and Logistics Dashboard in Excel — Track fleet operations, delivery timelines, and transportation costs in Excel.
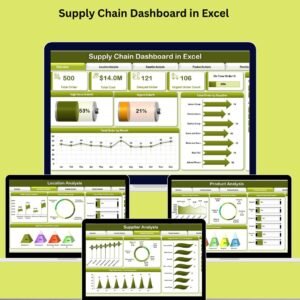
🔹 Supply Chain Dashboard in Excel — End-to-end supply chain visibility with supplier performance and logistics tracking.
📖 Click here to read the Detailed Blog Post
🎥 Visit our YouTube channel to learn step-by-step video tutorials
👉 YouTube.com/@NextGenTemplates
















Reviews
There are no reviews yet.