
The Operations KPI Dashboard in Google Sheets is a powerful tool designed to help businesses monitor and analyze key performance indicators (KPIs) related to their operational processes. By utilizing this dashboard, organizations can gain valuable insights into their operational efficiency, identify areas for improvement, and make data-driven decisions to enhance overall performance.
This dashboard helps track critical metrics such as production efficiency, supply chain performance, and quality control, providing businesses with real-time data to optimize their operations. The ability to visualize this data with customizable charts ensures that teams can make informed decisions and take corrective actions when necessary.

Key Features of the Operations KPI Dashboard in Google Sheets
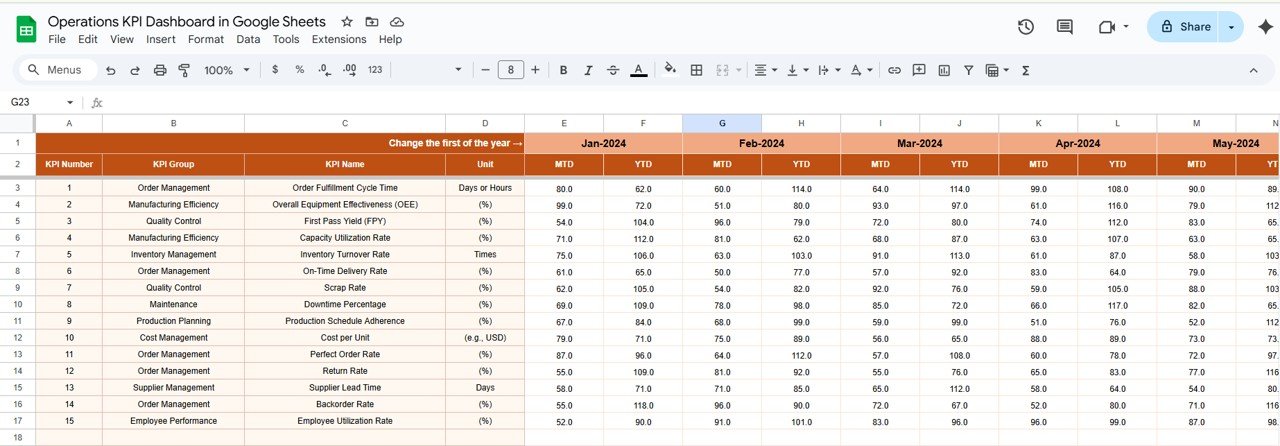
📊 Comprehensive Performance Tracking
-
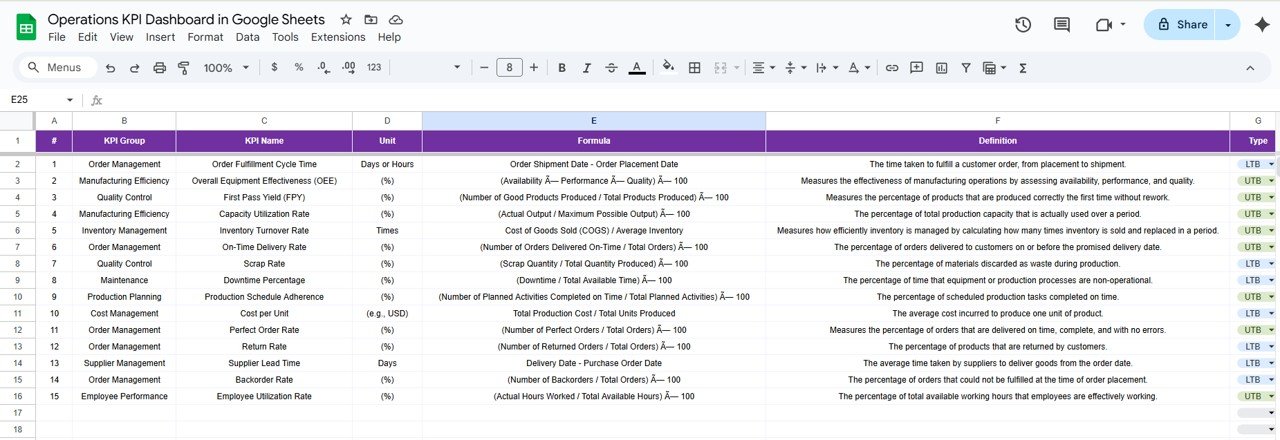
Customizable KPIs: Tailor the dashboard to track metrics that align with your specific operational goals, such as production efficiency, supply chain performance, or quality control metrics.
-
Data Integration: Seamlessly import data from various sources into Google Sheets, ensuring that your dashboard reflects the most current and accurate information.
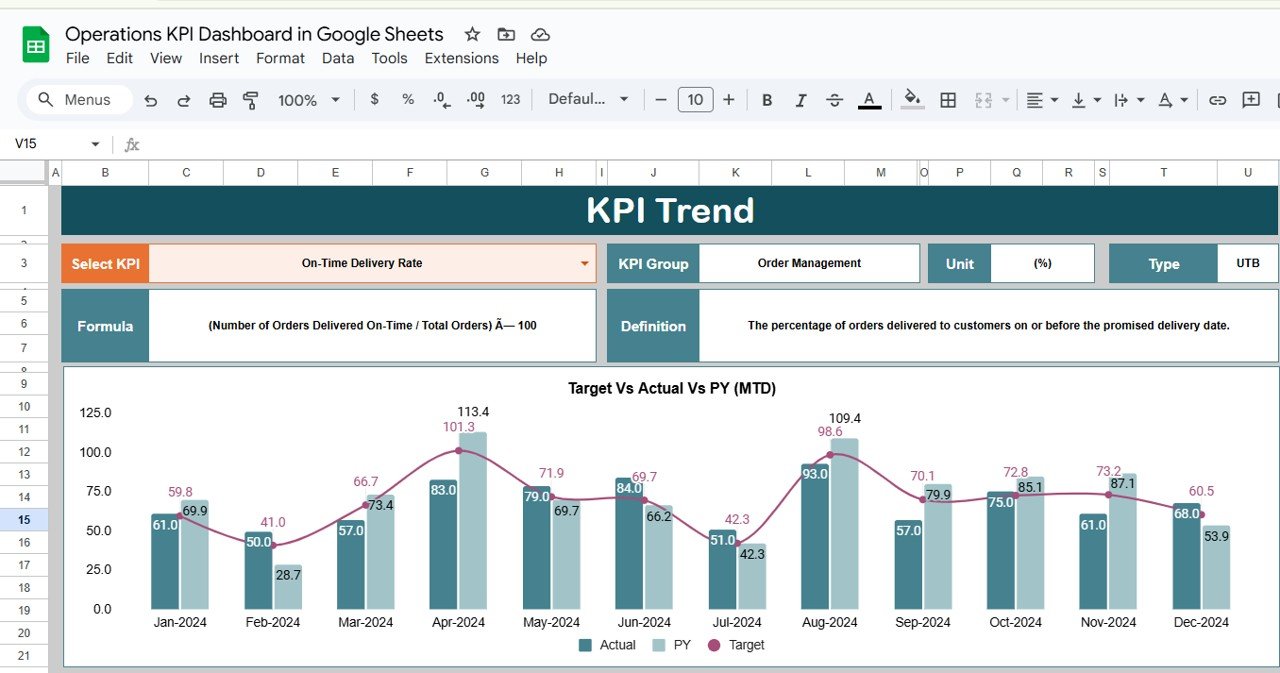
📈 Interactive Data Visualization
-
Dynamic Charts and Graphs: Utilize a variety of chart types, including line graphs, bar charts, and pie charts, to visually represent your KPIs, making it easier to identify trends and outliers.
-
Real-Time Updates: Experience automatic updates as new data is entered, ensuring that your dashboard provides up-to-date insights at all times.
🖥 User-Friendly Interface
-
Intuitive Design: The dashboard is designed for ease of use, allowing users with varying levels of expertise to navigate and interpret the data effectively.
-
Collaborative Features: Share the dashboard with your team, fostering transparency and collaborative decision-making.
🔒 Data Integrity and Security
-
Cloud-Based Accessibility: Access your dashboard securely from any location, ensuring that you can monitor your operations on-the-go.
-
Permission Settings: Control user access levels to protect sensitive operational data, ensuring that only authorized personnel can view or edit specific information.
Benefits of Using the Operations KPI Dashboard in Google Sheets
✅ Enhanced Decision-Making
Real-time data and visualizations enable quick identification of operational inefficiencies, supporting timely and informed decisions.
✅ Improved Operational Efficiency
By closely monitoring KPIs, you can identify bottlenecks and areas for improvement, leading to streamlined processes and cost savings.
✅ Strategic Planning
Access to comprehensive data empowers you to develop effective operational strategies, driving sustained growth and competitiveness.
✅ Scalability
As your business grows, the dashboard can accommodate increased data volume and complexity, supporting your evolving operational needs.
Getting Started with the Operations KPI Dashboard in Google Sheets
-
Identify Key Operational Metrics: Determine which KPIs are most relevant to your business operations and align with your strategic objectives.
-
Set Up Data Sources: Integrate your existing data sources with Google Sheets, ensuring that data flows seamlessly into your dashboard.
-
Customize the Dashboard: Tailor the dashboard layout, charts, and tables to focus on your chosen KPIs, making it a personalized tool for your operational needs.
-
Collaborate and Share: Share the dashboard with team members and stakeholders, fostering a data-driven culture and collaborative approach to operational management.
By implementing the Operations KPI Dashboard in Google Sheets, businesses can transform their operational data into actionable insights, leading to improved efficiency, strategic growth, and a competitive edge in the market.
Click here to read the Detailed blog post
Operations KPI Dashboard in Google Sheets
Visit our YouTube channel to learn step-by-step video tutorials
YouTube.com/@PKAnExcelExpert


Reviews
There are no reviews yet.