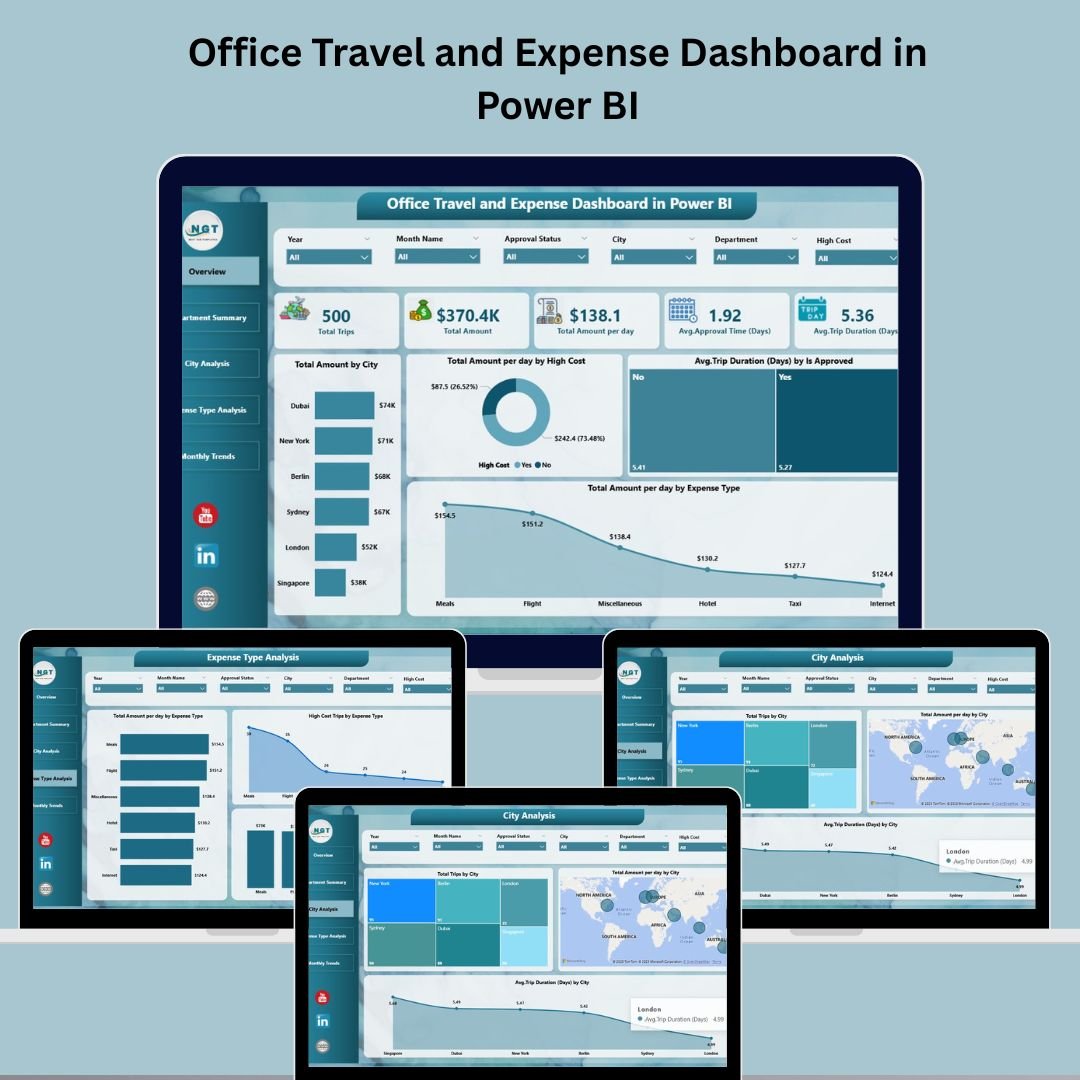
✈️ Key Features of Office Travel and Expense Dashboard in Power BI
📌 All-in-One Dashboard
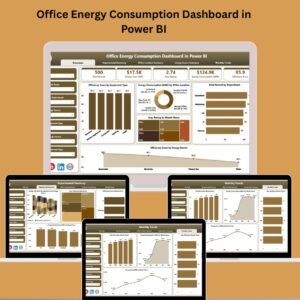
Track all your office travel-related expenses—flights, hotels, meals, and more—with a single, dynamic Power BI file powered by Excel data.
📊 5 Fully Interactive Pages
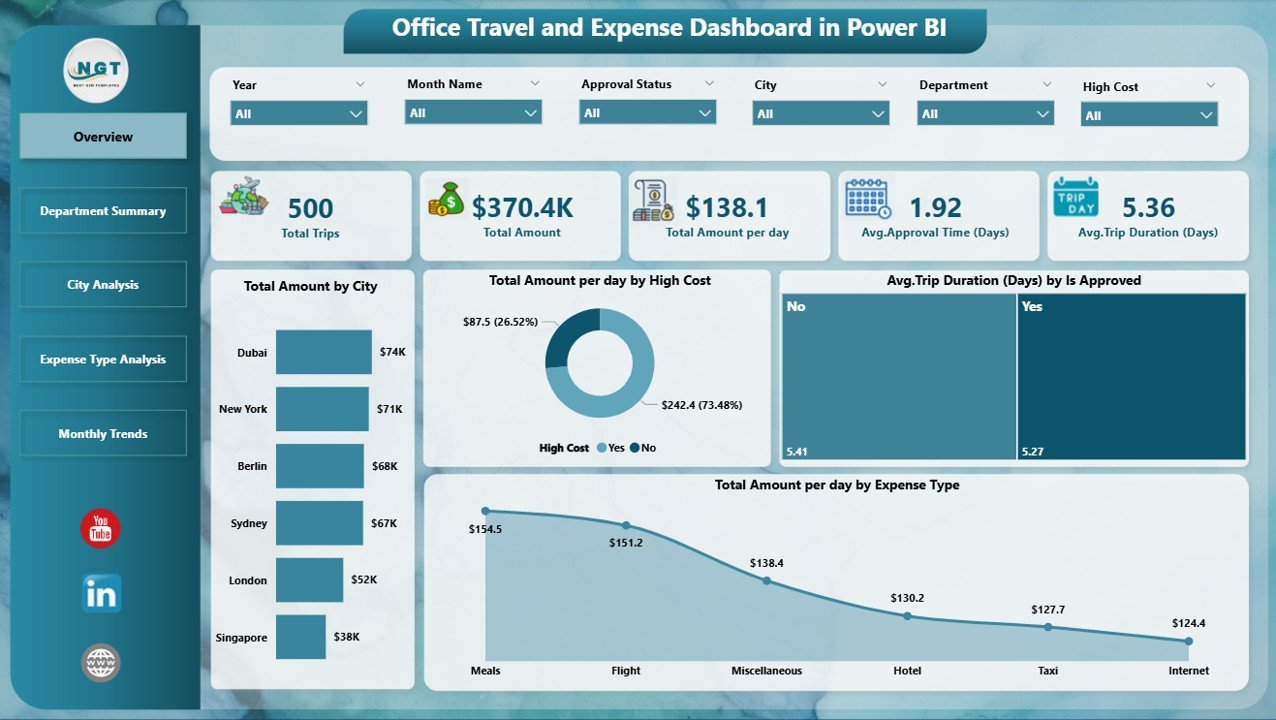
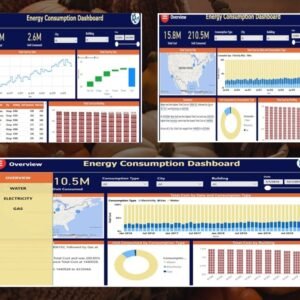
Navigate between Overview, Department Summary, City Analysis, Expense Type Analysis, and Monthly Trends with index buttons and slicers for fast, clear insights.
💼 Real-Time Expense Tracking
Monitor total trip costs, average cost per day, trip durations, and approval ratios in real time with built-in refresh capabilities.
🧭 Smart Filters for Targeted Views
Slicers let you filter data by City, Department, Expense Type, Approval Status, and more—perfect for drilling into specific cost centers.
💸 Cost vs Duration Analysis
Instantly see which departments or cities incur high costs or longer trips—pinpoint savings opportunities.
🧾 City-wise and Department-wise Reporting
Easily compare spending trends across cities or departments to optimize budgets and reduce travel overheads.
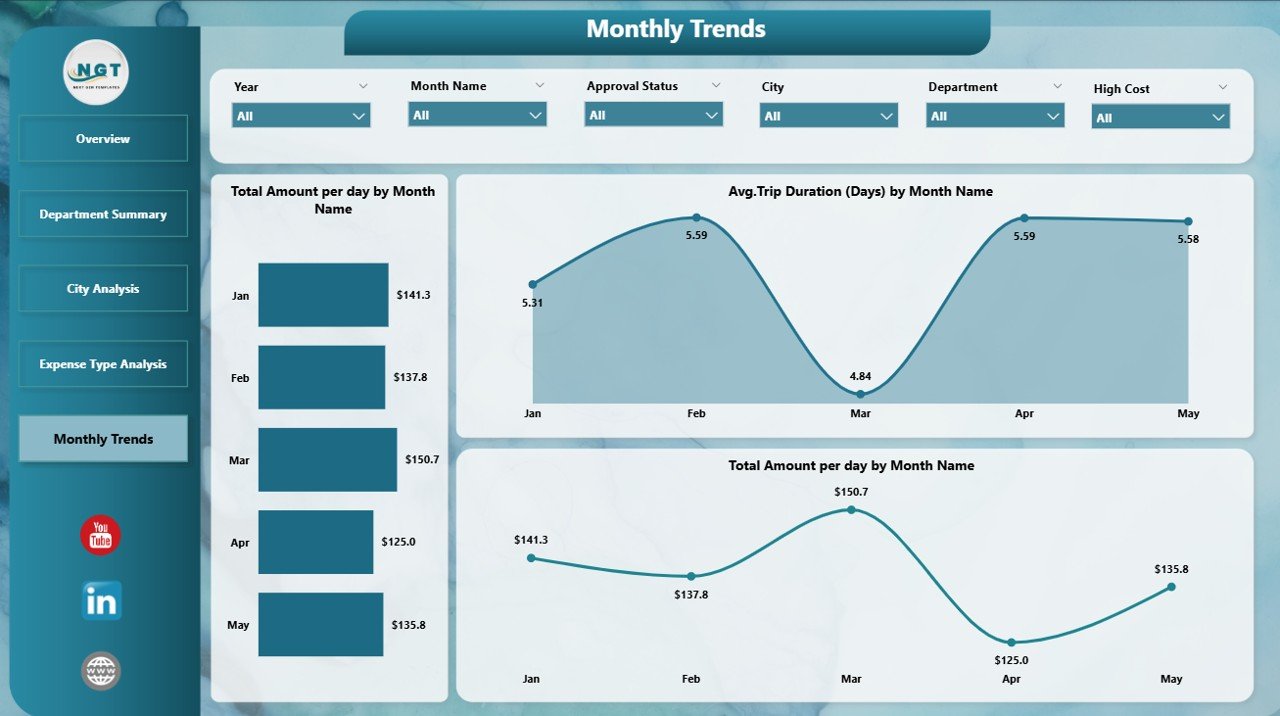
📅 Monthly Trend Insights
Understand when your organization spends the most—perfect for quarterly reviews, budget planning, and seasonal campaign analysis.
📥 Excel-Powered, No Code Needed
Built entirely in Power BI Desktop with an Excel backend. No coding or DAX expertise required.
📂 What’s Inside the Office Travel and Expense Dashboard
✅ Power BI Desktop File (.pbix) – Prebuilt and ready to use with Excel data
✅ 5 Analytical Pages:
-
Overview Page – KPIs + Cost Breakdown by City, Duration, Approval
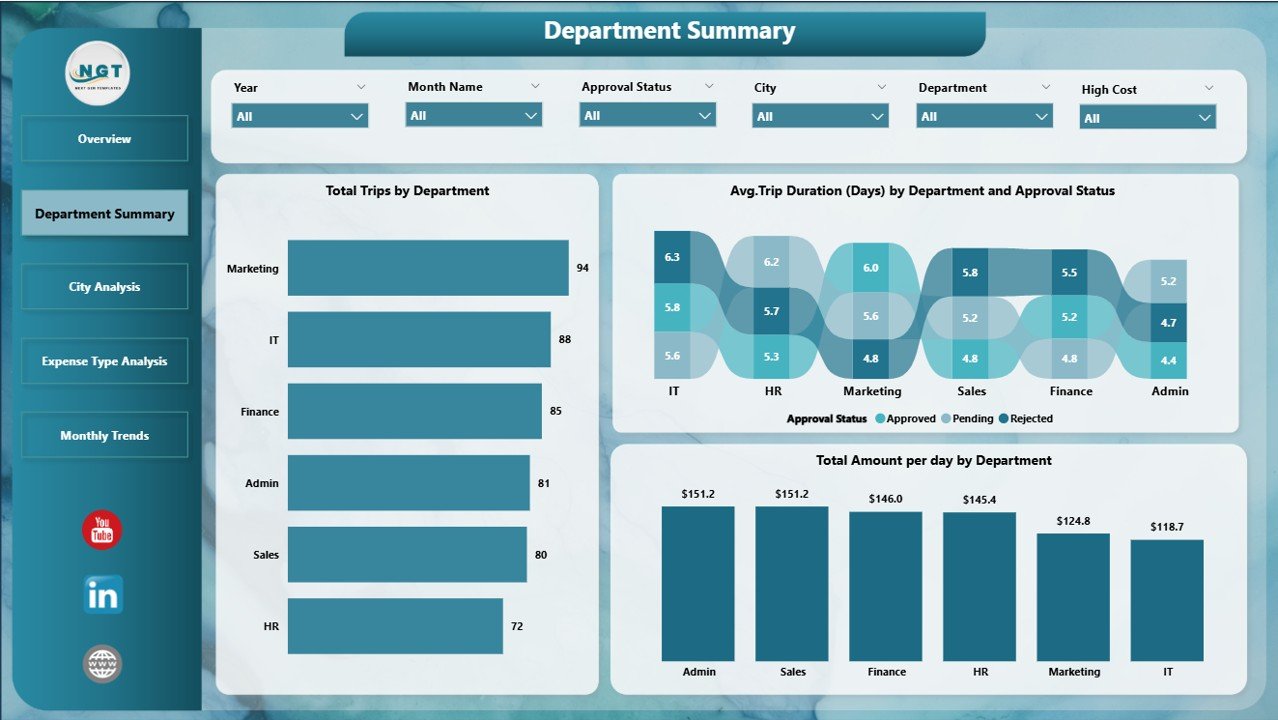
-
Department Summary Page – Track who’s spending and how much
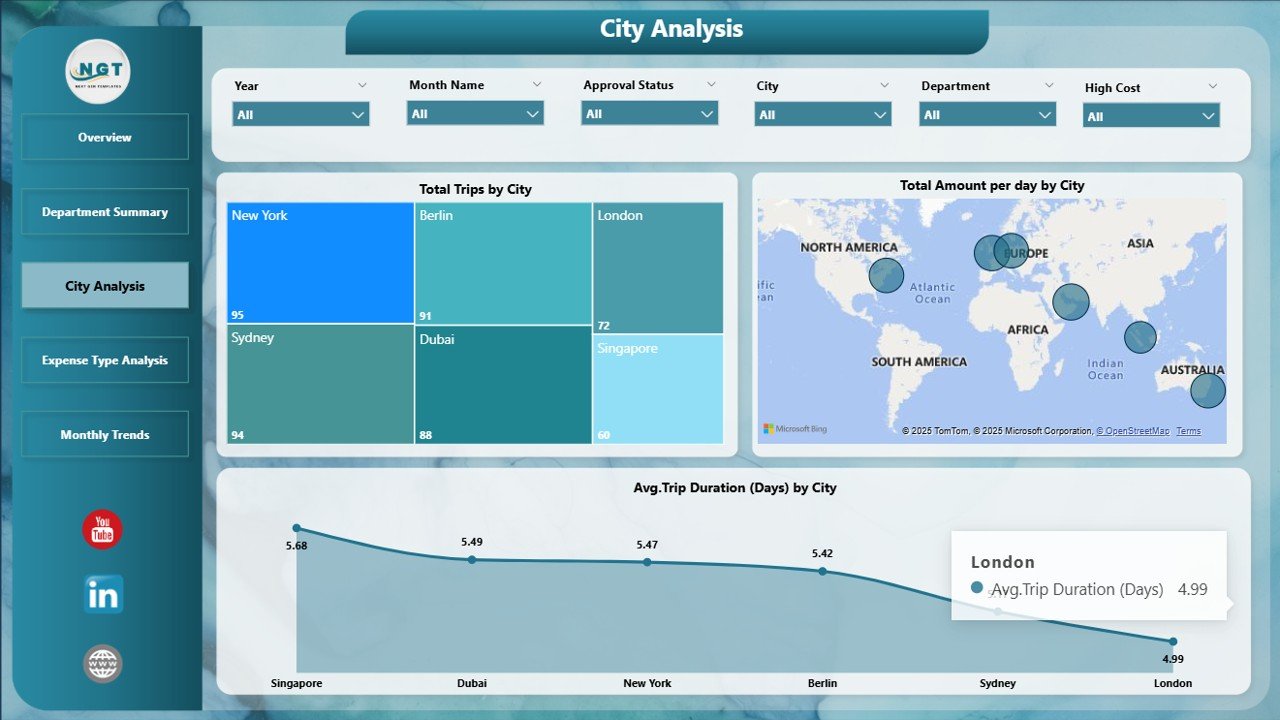
-
City Analysis Page – Compare city-level expenses and durations
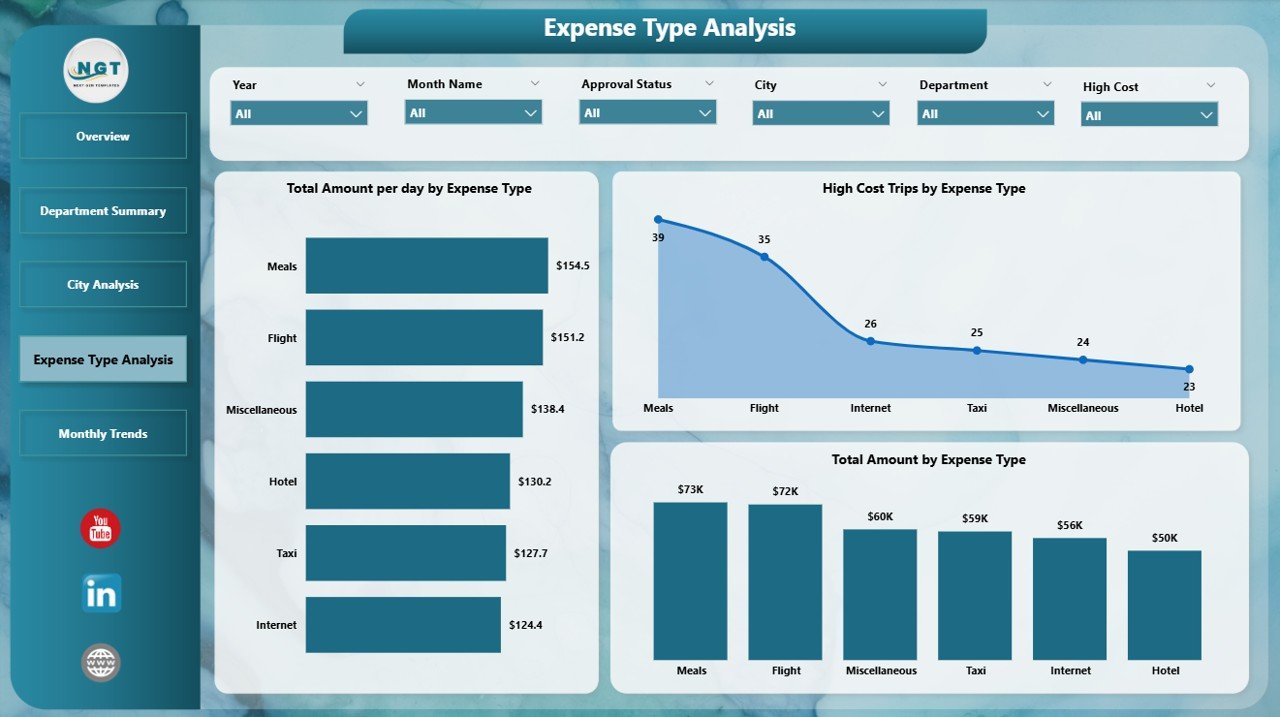
-
Expense Type Analysis Page – Visualize which categories are costing you more
-
Monthly Trends Page – Analyze travel expense patterns over time
✅ 6 to 8 Slicers Per Page – Filter by department, city, month, expense type, etc.
✅ Dynamic KPI Cards – Total Trips, Average Cost, Duration, Approval Ratios
✅ Pivot-Based Visuals – Track metrics like cost per day, trip count, and approval delays
✅ Compatible with Excel Data – Plug in your own data, refresh, and start analyzing
⚙️ How to Use the Office Travel and Expense Dashboard
🧭 Step 1: Open Power BI Desktop
Install Power BI Desktop (free), and open the included dashboard file.
📂 Step 2: Connect to Excel Data Source
Replace the demo Excel file with your organization’s actual travel data (City, Trip Date, Cost, Department, etc.).
🔄 Step 3: Refresh the Data
Use the refresh button to sync your latest entries—dashboard KPIs and visuals update instantly.
🧮 Step 4: Use Slicers and Charts
Filter by city, expense type, approval status, or month to extract targeted insights in seconds.
📤 Step 5: Export for Reports
Need to share insights? Export visuals as images or download full pages as PDFs for easy presentation.
👥 Who Can Benefit from This Dashboard
🧑💼 HR Managers – Track team movements, policy compliance, and approval delays
📊 Finance Departments – Manage budgets, detect overages, and cut down unnecessary costs
🛫 Travel Coordinators – Monitor vendor-specific trends, plan bulk bookings smartly
🏢 Executives & CXOs – Make fast, data-backed decisions on business travel policies
🧾 Admin & Operations Staff – Simplify reimbursements, avoid manual entry errors


Reviews
There are no reviews yet.