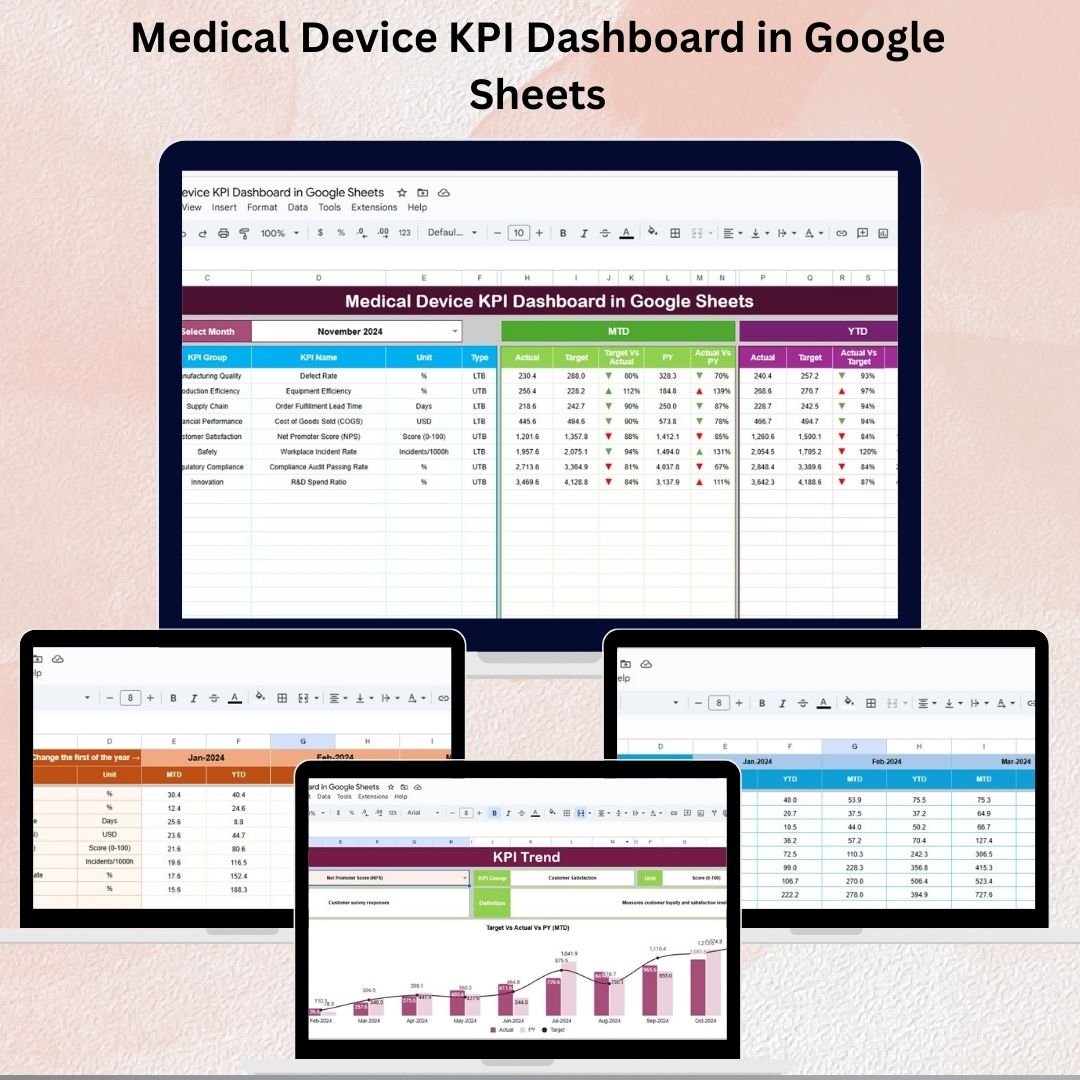
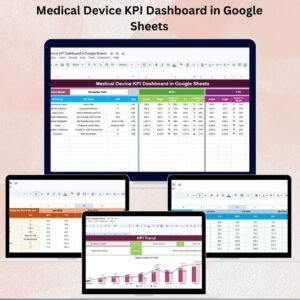
In the medical device industry, tracking key performance metrics is essential for ensuring regulatory compliance, operational efficiency, and product quality. Without proper monitoring, businesses risk compliance issues, production delays, and reduced profitability. That’s why we created the Medical Device KPI Dashboard in Google Sheets – a ready-to-use, interactive solution that consolidates all your KPIs, targets, and trends in one dynamic file.
Designed for managers, quality teams, and operational leaders, this dashboard provides a monthly and yearly performance snapshot to help you compare Actuals vs Targets and evaluate year-over-year improvements. With structured input sheets and dynamic calculations, you’ll always have real-time visibility into your performance metrics.
⭐ Key Features of the Medical Device KPI Dashboard
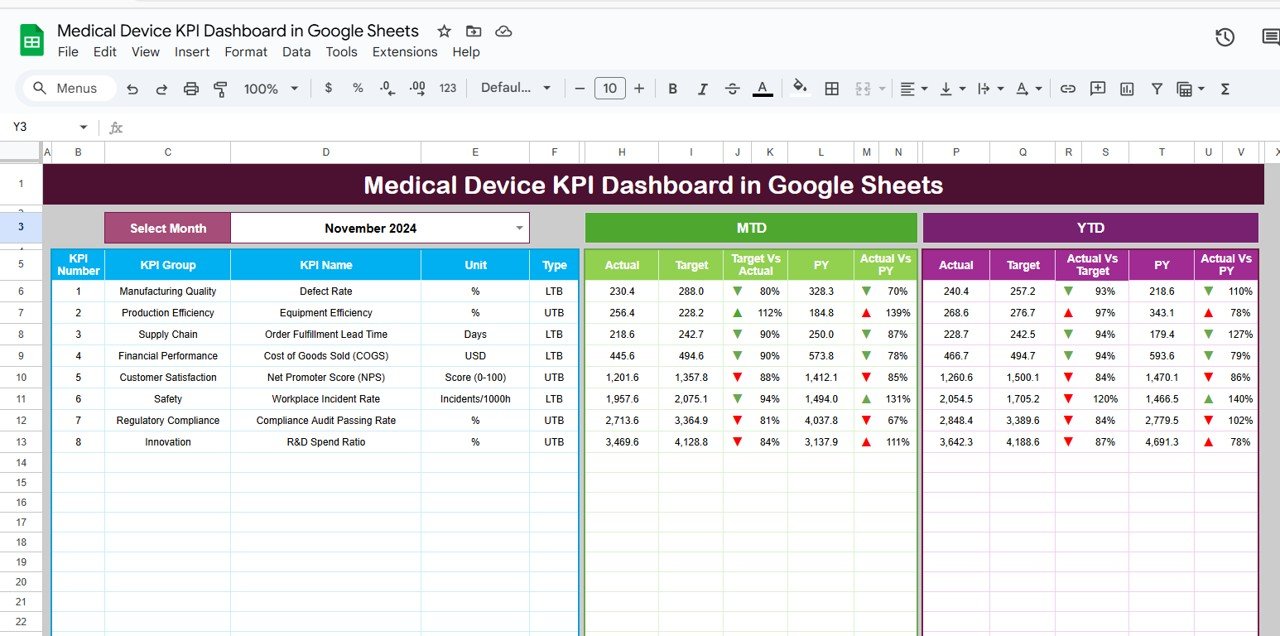
1. Dashboard Sheet Tab 🩺
-
Select any month from a dropdown to update all metrics automatically.
-
Track MTD (Month-to-Date) and YTD (Year-to-Date) performance.
-
Compare Actual vs Target and Actual vs Previous Year instantly.
-
📈 Conditional formatting with arrows highlights positive or negative trends.
This sheet acts as the central performance overview of your medical device operations.
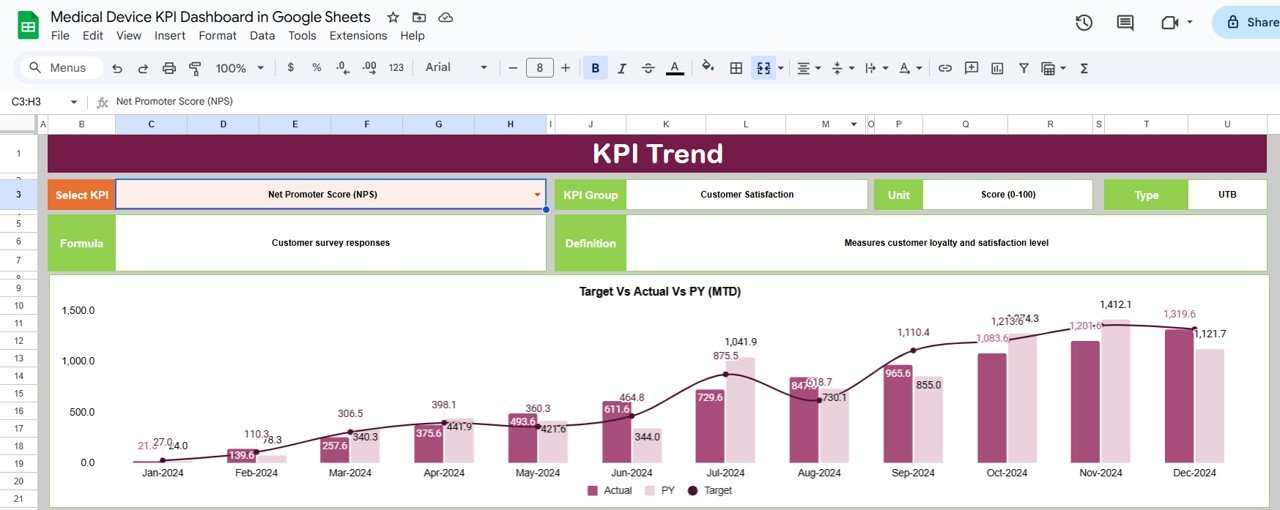
2. KPI Trend Sheet Tab 📊
-
Pick any KPI from a dropdown to see its historical trend.
-
View KPI group, unit, type (LTB/UTB), formula, and definition.
-
Analyze how KPIs are performing over time against thresholds.
This ensures stakeholders understand what each KPI measures and how it’s calculated.
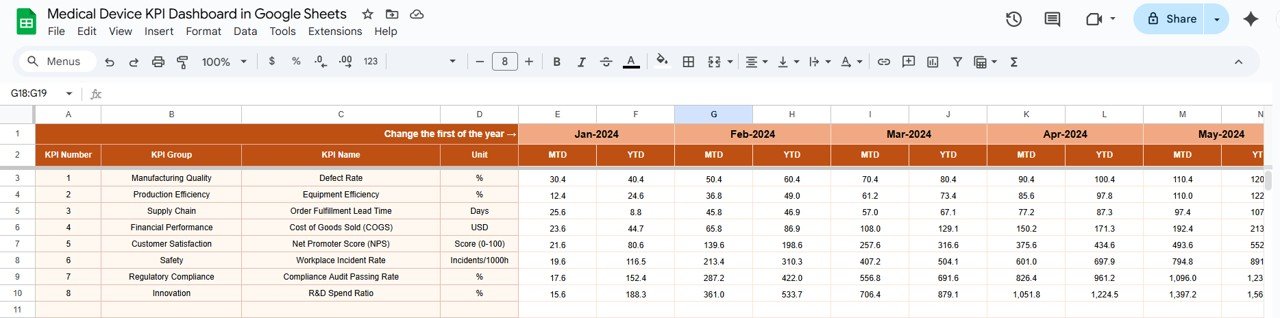
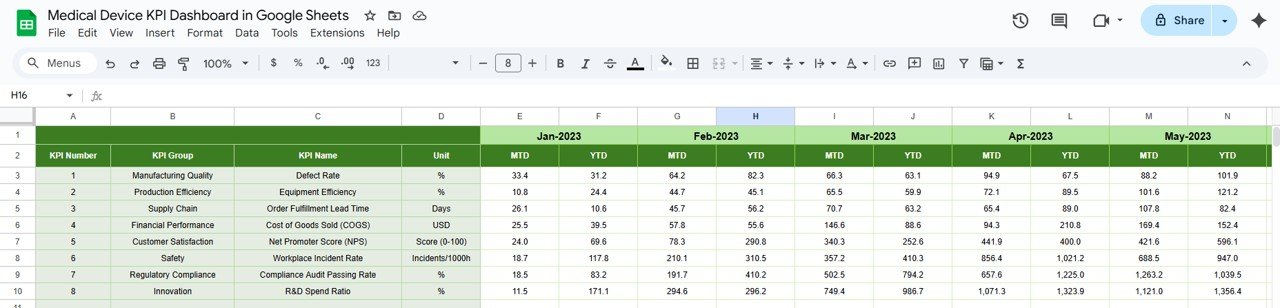
3. Actual Numbers Sheet Tab ✍️
-
Input MTD and YTD actuals for each KPI.
-
Select month/year (Range E1) to align data automatically.
-
YTD performance is calculated based on monthly inputs.
A structured way to enter actual results that feeds into the dashboard.
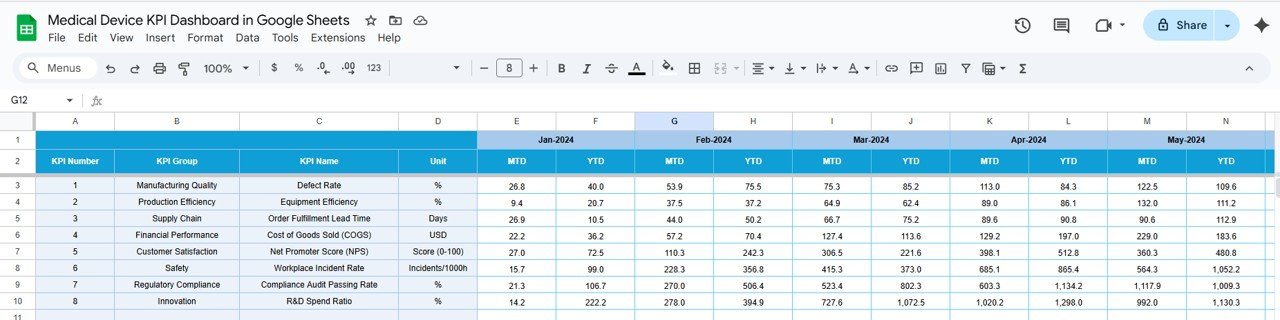
4. Target Sheet Tab 🎯
-
Enter monthly targets (MTD) and cumulative YTD targets.
-
Provides an automatic comparison of Actual vs Target in the dashboard.
Ensures all stakeholders work towards clearly defined goals.
5. Previous Year Numbers Sheet Tab 📆
-
Enter last year’s MTD and YTD KPI values.
-
Compare year-over-year performance trends.
This helps track improvements and identify areas of decline.
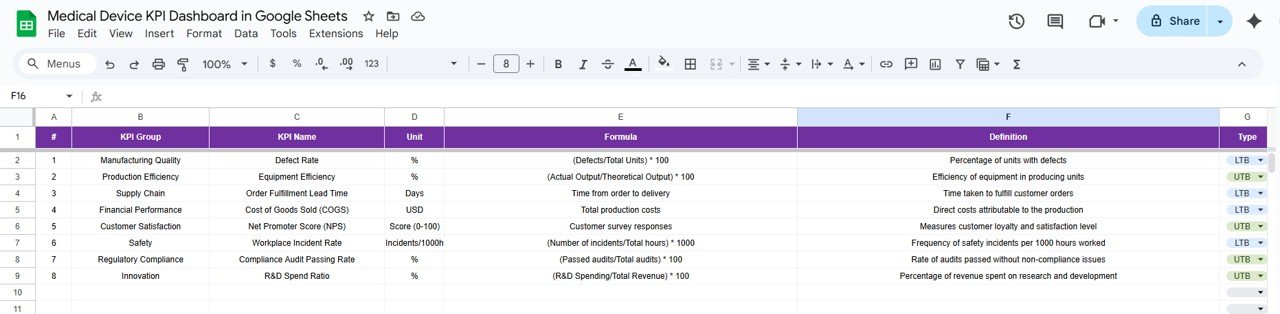
6. KPI Definition Sheet Tab 📖
-
Lists KPI Name, Group, Unit, Formula, Definition, and Indicator Type.
-
Ensures clarity and consistency across teams.
Perfect for onboarding new users and aligning departments on KPI meaning.
💡 Advantages of the Dashboard
-
⚡ Interactive & Dynamic – Choose any month, and all KPIs update instantly.
-
📊 Trend Analysis – Compare Actual vs Target vs Previous Year.
-
📑 Centralized Metrics – All KPIs, definitions, and formulas in one place.
-
🖥️ Easy Data Entry – Separate structured tabs for Actuals, Targets, and Previous Year.
-
🚨 Performance Alerts – Arrows and color coding flag underperforming KPIs.
🚀 Opportunities for Improvement
-
🔗 Integrate with ERP or MES systems for automatic data capture.
-
🎨 Add KPI charts or heatmaps for more visual analysis.
-
👥 Break down KPIs by department or product line.
-
🔔 Add automated notifications when KPIs miss thresholds.
📝 Best Practices
-
Update Actuals, Targets, and Previous Year regularly.
-
Use KPI Trend Sheet to review long-term performance.
-
Ensure all team members understand Lower the Better vs Upper the Better KPIs.
-
Leverage Google Sheets’ sharing for real-time team collaboration.
-
Align KPI review cycles with quality standards and compliance goals.
✅ Conclusion
The Medical Device KPI Dashboard in Google Sheets is an essential tool for tracking compliance, operational efficiency, and quality metrics in the medical device industry. With its dynamic dashboards, structured input sheets, and detailed KPI definitions, it empowers organizations to make data-driven decisions, improve efficiency, and maintain regulatory compliance.
📌 Click here to read the Detailed Blog Post
Watch the step-by-step video Demo:


Reviews
There are no reviews yet.