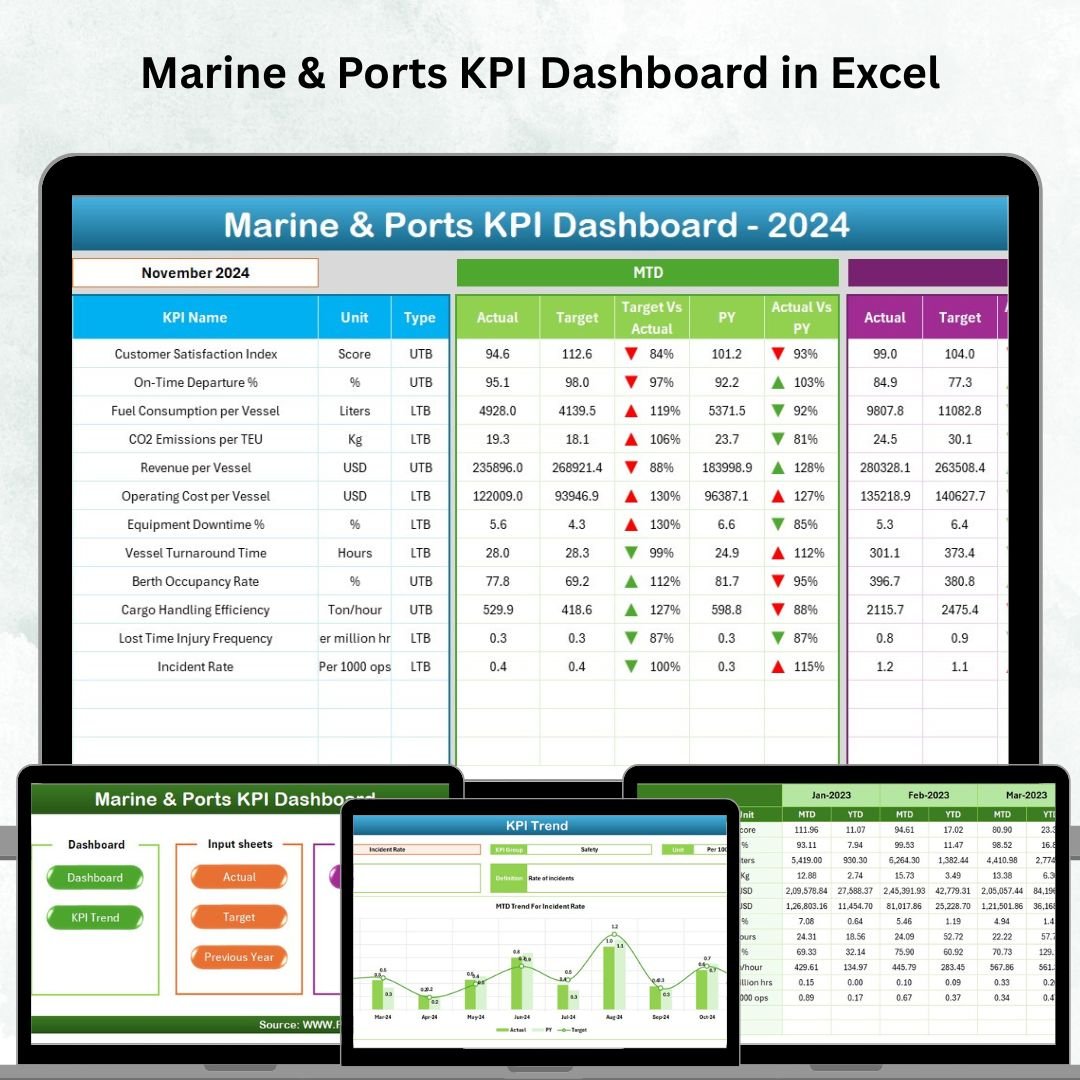
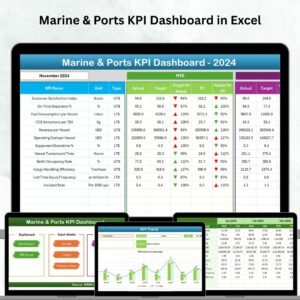
Managing marine and port operations is a complex task with countless moving parts—cargo handling, berth occupancy, vessel turnaround times, safety checks, and financial tracking. In today’s world of global trade, these challenges demand a reliable solution. That’s exactly where the Marine & Ports KPI Dashboard in Excel comes in 🚢📊.
This ready-to-use Excel dashboard is designed to transform raw operational data into meaningful insights. With structured worksheets, interactive charts, and standardized KPI definitions, it empowers managers and operators to monitor performance, improve accountability, and enhance decision-making—all without expensive or complicated software.
⚡ Key Features of Marine & Ports KPI Dashboard in Excel
✅ All-in-One Monitoring – Track operational, safety, and financial KPIs in one centralized file.
✅ 7 Structured Worksheets – From data input to KPI definitions, everything is neatly organized.
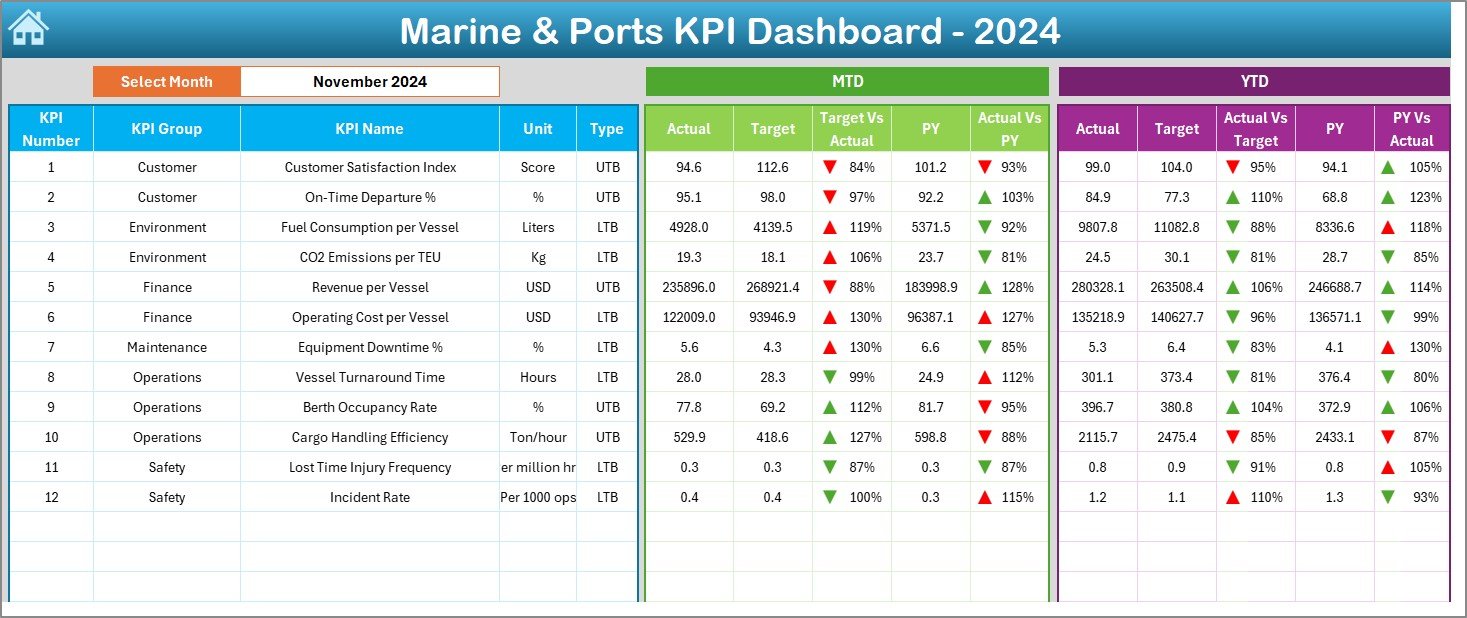
✅ MTD & YTD Analysis – Instantly compare Monthly-to-Date and Year-to-Date results against targets and previous years.
✅ Dynamic Visuals – Charts, slicers, and conditional formatting make performance crystal clear.
✅ Easy Navigation – The Home sheet acts as an index, letting you jump between pages with a single click.
✅ Benchmarking Power – Identify improvements by comparing current vs previous year data.
✅ Excel-Based Flexibility – No new software needed—just open, update, and track.
📂 What’s Inside the Marine & Ports KPI Dashboard
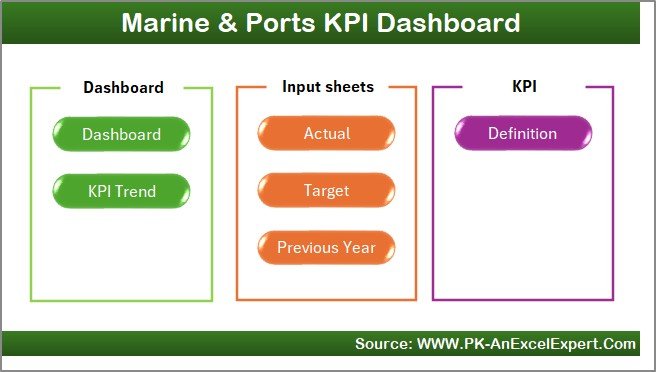
This product is packed with 7 dedicated sheets designed to cover every aspect of port performance:
-
Home Sheet – Your navigation hub with quick links to all sections.
-
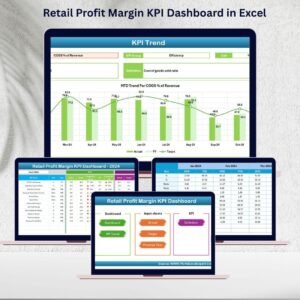
Dashboard Sheet – Main reporting page with KPI cards, charts, and a month selector.
-
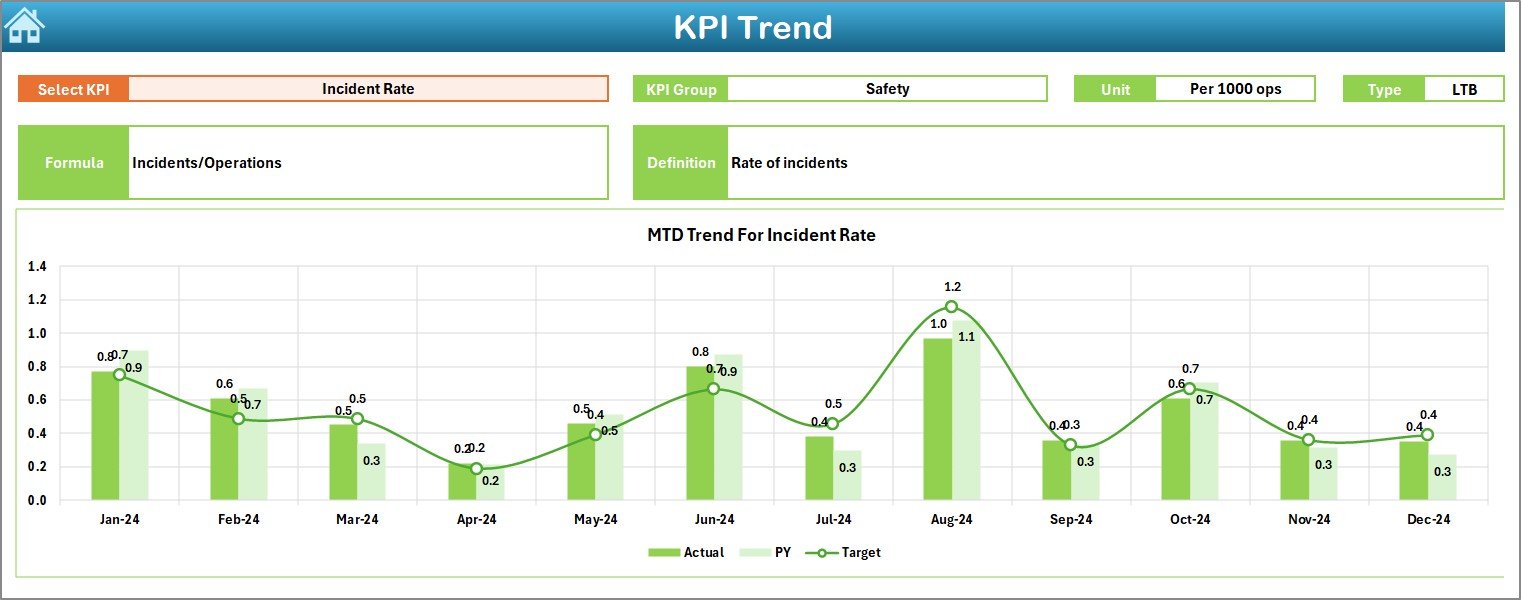
KPI Trend Sheet – Visualize historical performance trends with dropdown analysis.
-
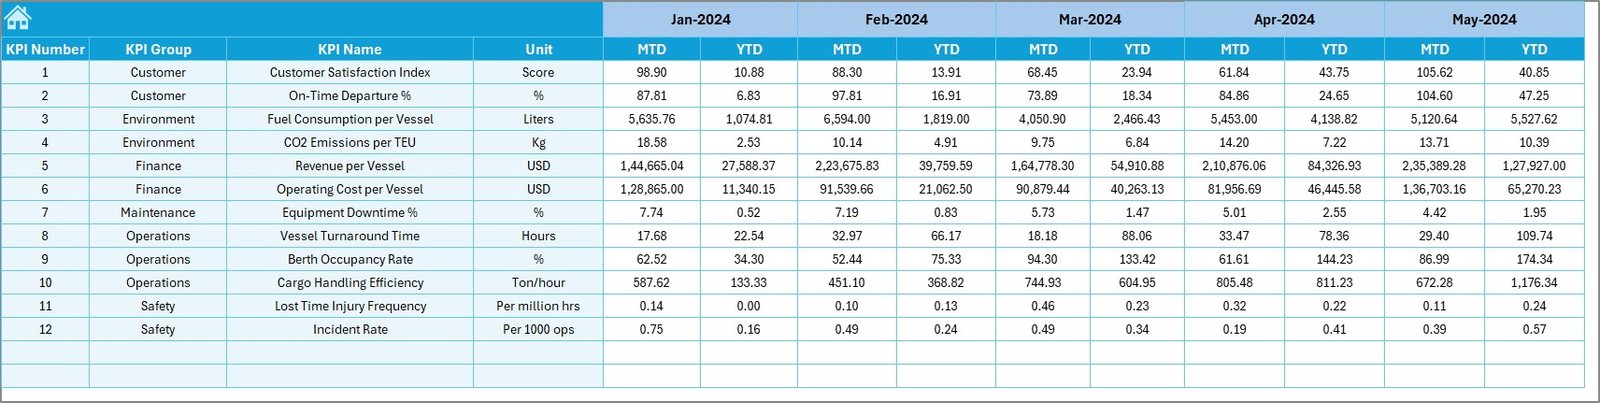
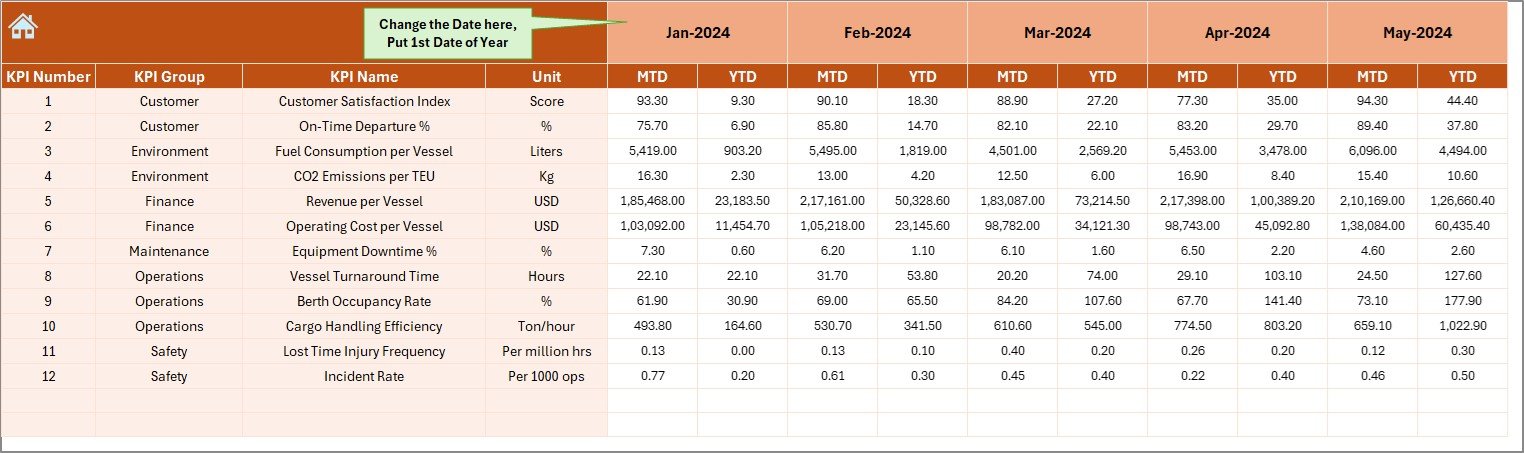
Actual Numbers Sheet – Enter MTD and YTD actual data for automatic updates.
-
Target Sheet – Define performance expectations with monthly and yearly targets.
-
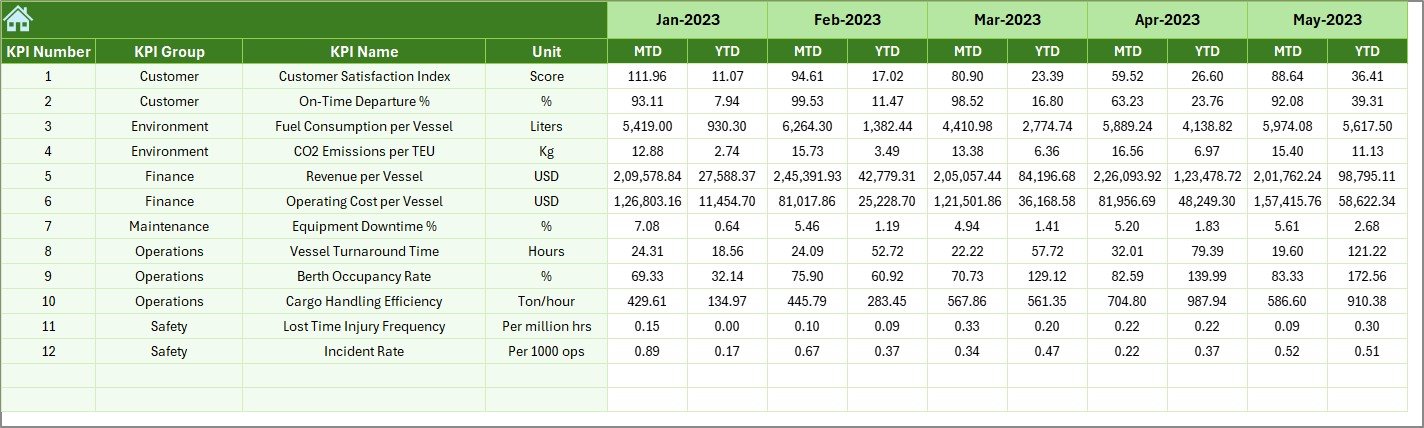
Previous Year Numbers Sheet – Benchmark current performance against last year.
-
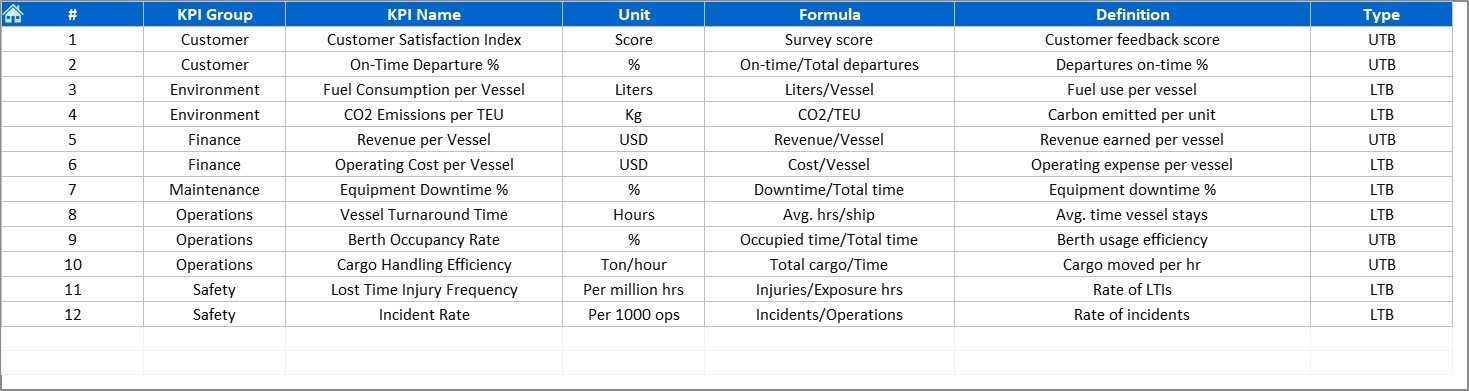
KPI Definition Sheet – Standardize KPI names, groups, formulas, and definitions for consistent reporting.
🛠️ How to Use the Marine & Ports KPI Dashboard
Using this dashboard is simple and effective:
-
Identify KPIs – Choose key metrics like cargo handling time, fuel efficiency, berth occupancy, or revenue per vessel.
-
Set Baselines – Enter last year’s numbers in the Previous Year sheet.
-
Add Targets – Input realistic monthly and yearly targets in the Target sheet.
-
Update Actuals – Record monthly performance in the Actual Numbers sheet.
-
Review Results – Switch months with the slicer and instantly see MTD/YTD vs Target vs Previous Year.
-
Take Action – Use insights to reduce delays, cut costs, improve safety, or increase revenue.
👥 Who Can Benefit from This Dashboard?
This tool is built for a wide range of marine and port stakeholders:
-
Port Authorities ⚓ – Oversee all aspects of port operations with structured insights.
-
Shipping Companies 🚢 – Track fleet operations, turnaround times, and efficiency.
-
Marine Safety Managers 🦺 – Monitor safety incidents and ensure compliance.
-
Finance Teams 💰 – Compare revenues and costs against targets for accountability.
-
Operations Managers ⚙️ – Spot bottlenecks early and make data-driven improvements.
-
Consultants & Analysts 📑 – Use standardized KPIs to deliver professional performance reports.


Reviews
There are no reviews yet.