


In today’s fast-paced business environment, HR departments need to monitor employee performance effectively to foster growth and optimize team dynamics. The HR Performance Dashboard in Power BI provides a powerful, interactive platform to visualize key HR metrics and make data-driven decisions. Here’s a look at its key features:
-
Comprehensive Data Visualizations: Power BI transforms HR data into intuitive visuals like maps, charts, and graphs, making it easier to track employee performance, attendance, salary distribution, and more.
-
Employee Performance Insights: Analyze employee performance across various metrics such as department, job title, location, and more.
-
Salary and Compensation Analysis: Monitor and compare salaries across departments, job titles, and locations to ensure equity and transparency.
-
Attendance Monitoring: Track attendance trends, absenteeism, and department-level attendance patterns.
-
Training and Development Tracking: Measure employee participation in training programs and monitor their growth and development.
-
Customizable Dashboard: Tailor the dashboard to fit your organization’s unique HR needs, adding or modifying metrics as necessary.
What’s Inside the HR Performance Dashboard in Power BI 📈
The HR Performance Dashboard includes several sections, each with a dedicated sheet to analyze key HR aspects:
-
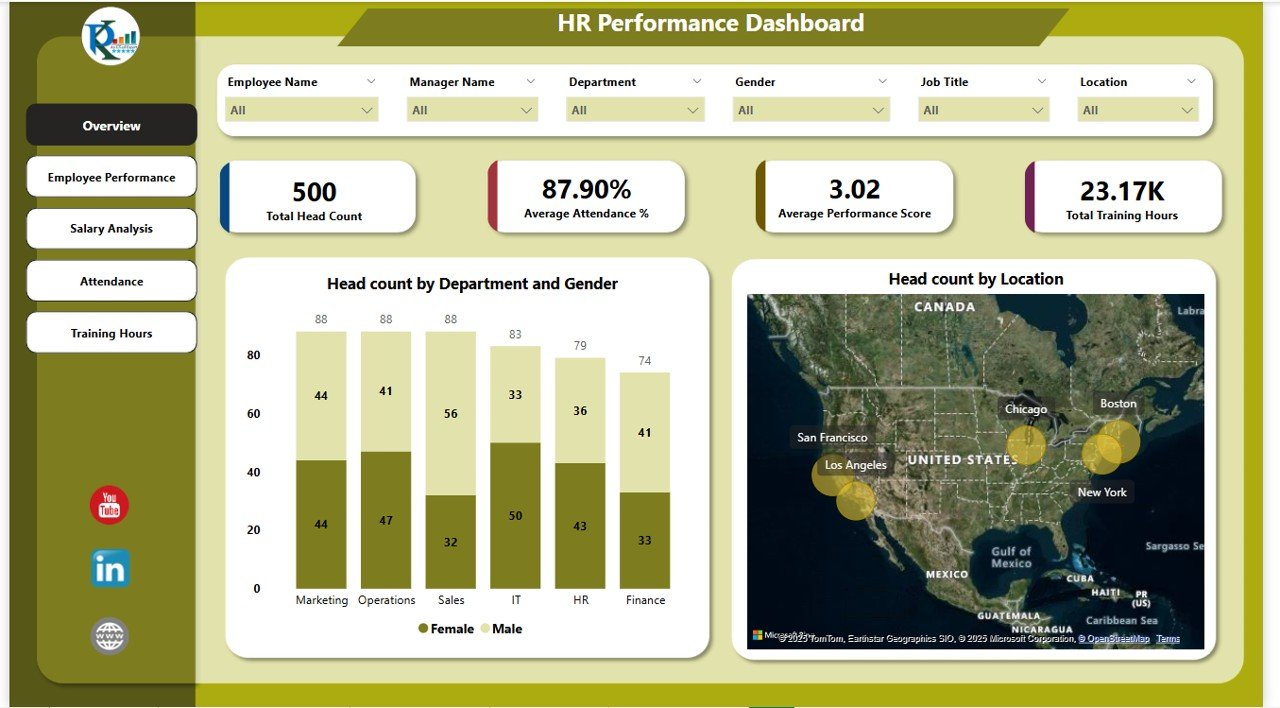
Overview Sheet Tab: This sheet provides a snapshot of the most critical HR metrics:
-
Cards: Key metrics like Total Head Count, Average Performance Score, Average Attendance %, and Total Training Hours.
-
Charts: Visual representations such as Head Count by Department and Gender (stacked column chart), Head Count by Location (map chart), and Actual Cost by Department (line chart).
-
-
Employee Performance Sheet Tab: Dive deeper into employee performance:
-
Charts: Performance scores by department, location, and job title. Also includes visualizations for the top and bottom-performing employees.
-
-
Salary Analysis Sheet Tab: Analyze salary distributions across departments, locations, and job titles:
-
Charts: Average salary by department (pie chart), job title (bar chart), and location (map chart).
-
-
Attendance Sheet Tab: Track attendance trends across departments, locations, and job titles:
-
Charts: Attendance visualizations, highlighting the top and bottom 5 employees in terms of attendance.
-
-
Training Hours Sheet Tab: Monitor the total number of training hours by department, location, and job title:
-
Charts: Visuals like training hours by department (donut chart), job title (bar chart), and location (map chart).
-
-
Data Sheet Tab: The data foundation where all employee-related information is input, such as:
-
Employee ID, Name, Gender, Department, Job Title, Location, Performance Scores, Attendance %, Salary, and more.
-
How to Use the HR Performance Dashboard in Power BI 🛠️
-
Input Data: Begin by entering your employee-related data in the Data Sheet. This will drive all the charts and reports in the dashboard.
-
Track Key Metrics: Use the Overview Sheet to monitor high-level metrics, such as employee performance, salary distribution, and attendance trends.
-
Analyze Employee Performance: Dive deeper into specific performance metrics using the Employee Performance Sheet.
-
Salary and Attendance Insights: Use the Salary Analysis Sheet and Attendance Sheet to evaluate compensation trends and monitor absenteeism across departments.
-
Monitor Training Progress: Keep an eye on employee development by tracking training hours and performance improvements through the Training Hours Sheet.
-
Collaborate and Share: Share the dashboard with HR teams, managers, and executives to provide visibility into HR performance metrics and foster data-driven decision-making.
Who Can Benefit from This HR Performance Dashboard? 👨💼
This dashboard is ideal for:
-
HR Managers: Monitor employee performance, salaries, attendance, and training in one place.
-
Department Heads: Track how your department is performing relative to others in terms of attendance, training hours, and performance scores.
-
Business Owners: Gain insights into workforce performance and compensation to make informed decisions.
-
Training Managers: Evaluate the effectiveness of training programs by tracking training hours and performance improvements.
-
Payroll and Finance Teams: Ensure salary equity across departments and track overall compensation trends.
Click here to read the Detailed blog post 📚
Watch the step-by-step video Demo:


Reviews
There are no reviews yet.