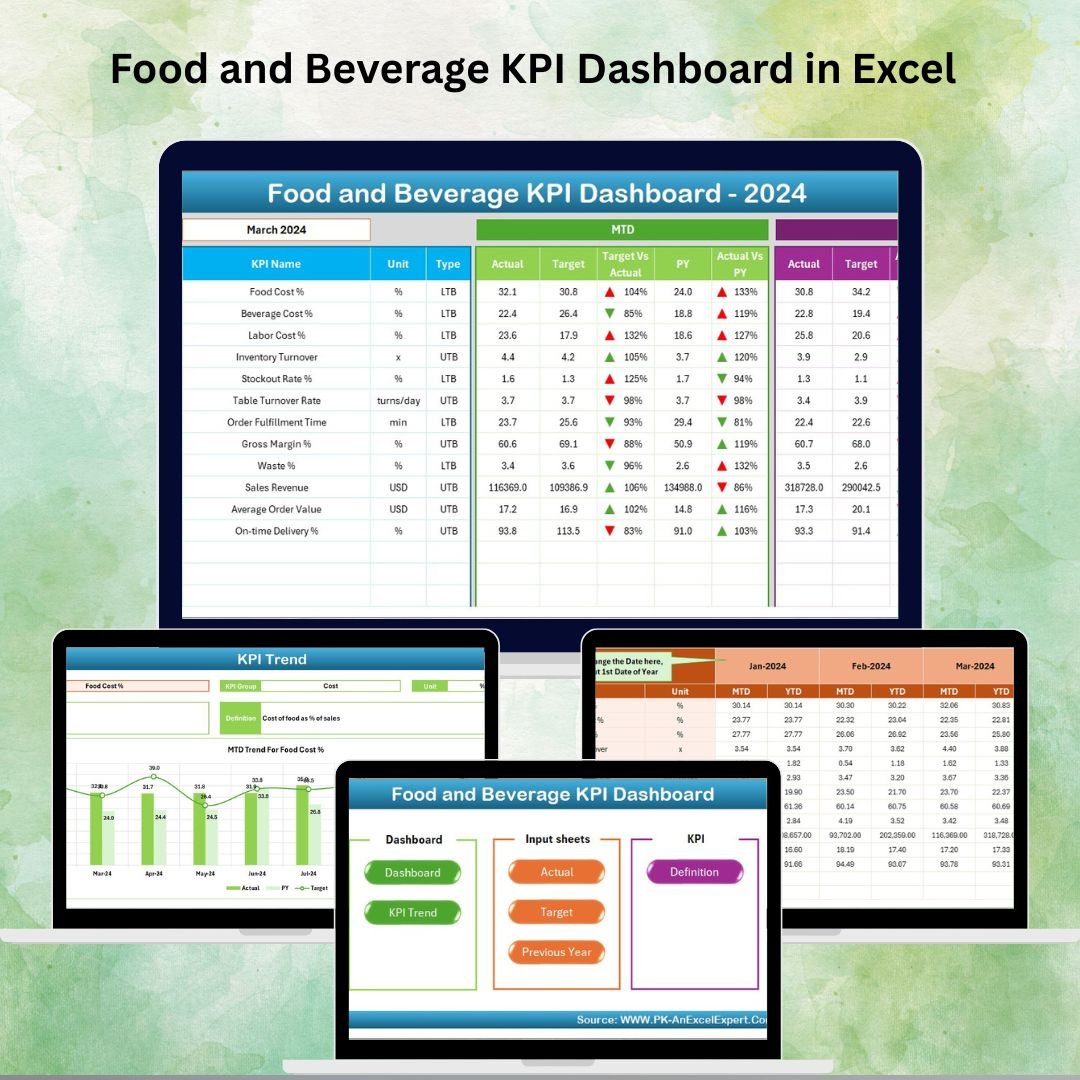
Running a food and beverage business is no easy task. From controlling food costs and labor expenses to maximizing customer satisfaction and monitoring growth, managers are constantly juggling multiple responsibilities. That’s why we’ve created the Food and Beverage KPI Dashboard in Excel — a ready-to-use, professional, and cost-effective solution that simplifies performance tracking and empowers smarter decisions.
This all-in-one dashboard template turns raw data into actionable insights. Whether you run a restaurant, café, catering service, bar, or large-scale food processing unit, this tool gives you complete control over your key metrics in a visually engaging and easy-to-understand way.
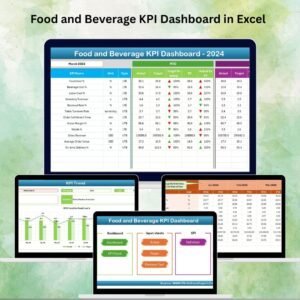
✨ Key Features of Food and Beverage KPI Dashboard in Excel
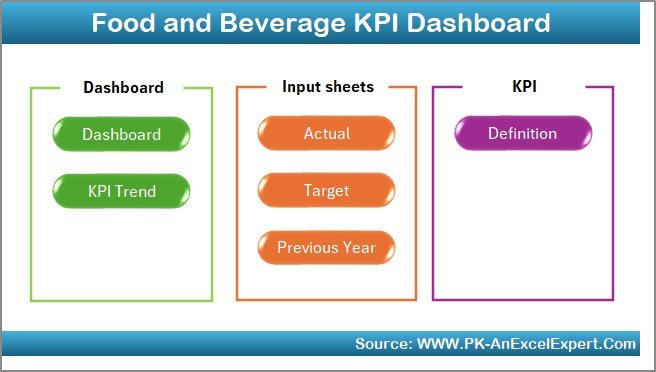
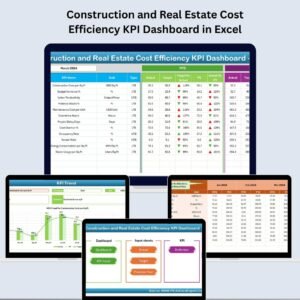
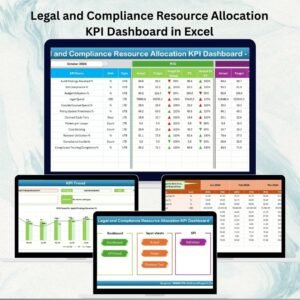
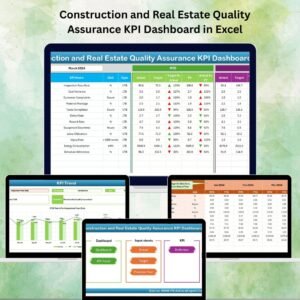
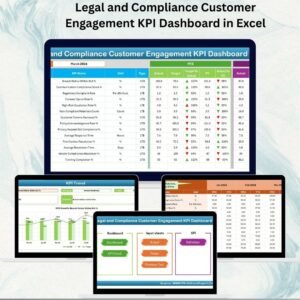
✅ 7 Pre-Built Worksheets – Includes Home, Dashboard, KPI Trend, Actual Numbers Input, Target, Previous Year, and KPI Definition sheets.
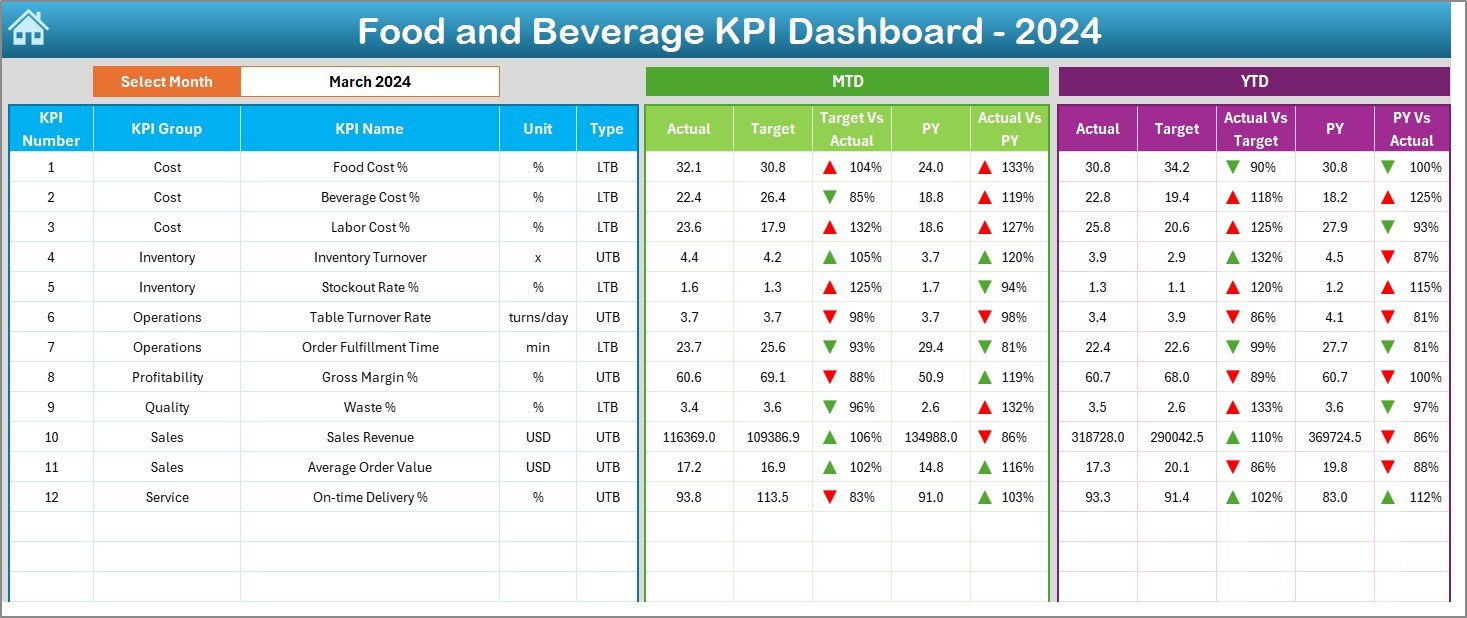
✅ Month Selection Dropdown – Quickly view data for any month, with MTD and YTD comparisons against targets and previous year.
✅ Conditional Formatting – Red/green arrows instantly show whether you’re beating or missing your targets.
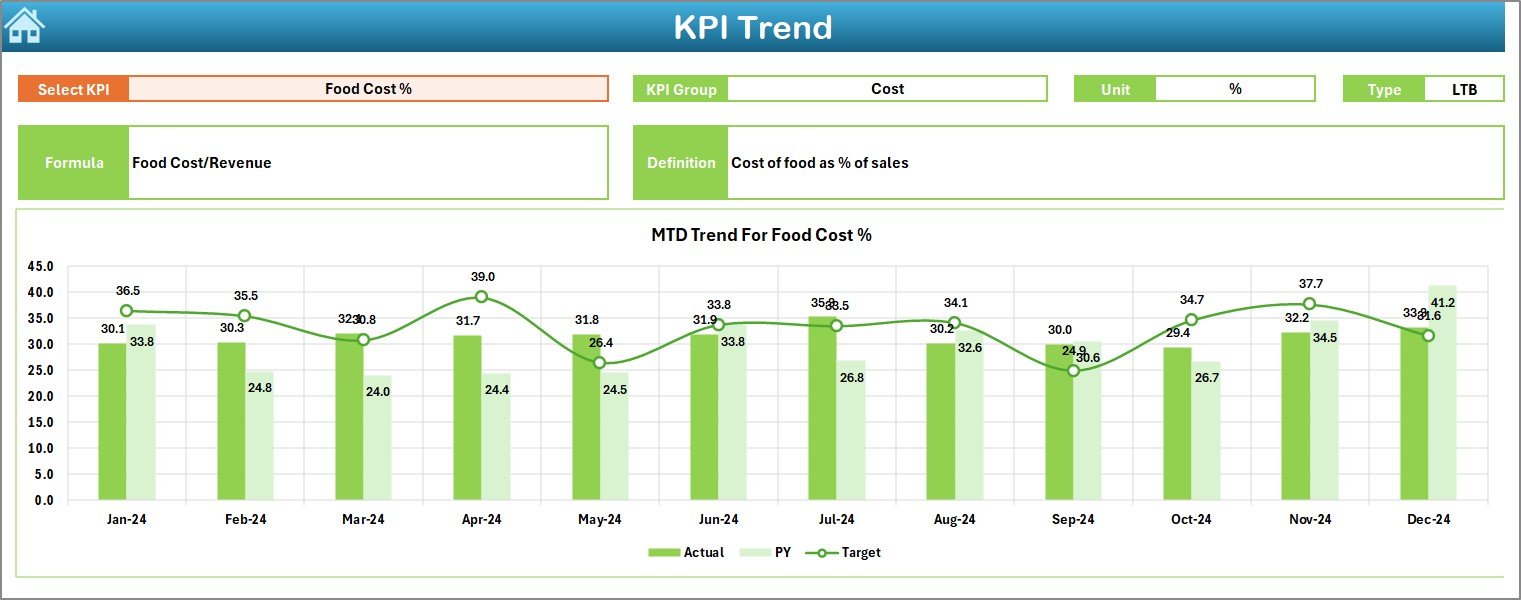
✅ Dynamic KPI Trend View – Select a KPI from the dropdown and analyze its detailed performance over time.
✅ Data Entry Made Simple – Just input your actual monthly numbers, and the dashboard updates automatically.
✅ Target Tracking – Define clear monthly and yearly goals for each KPI.
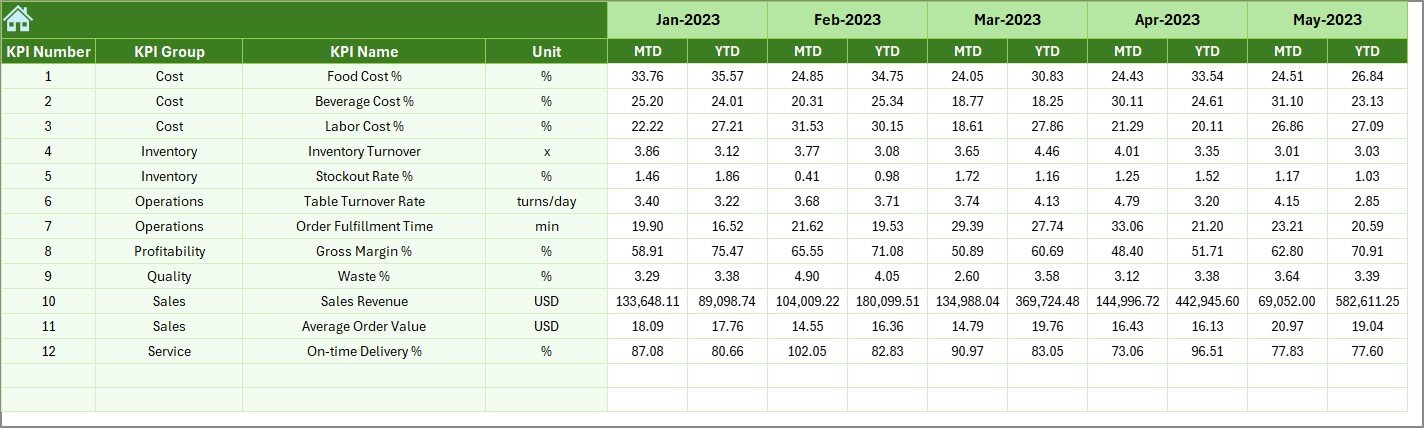
✅ Historical Benchmarking – Compare current data with last year to spot growth or decline trends.
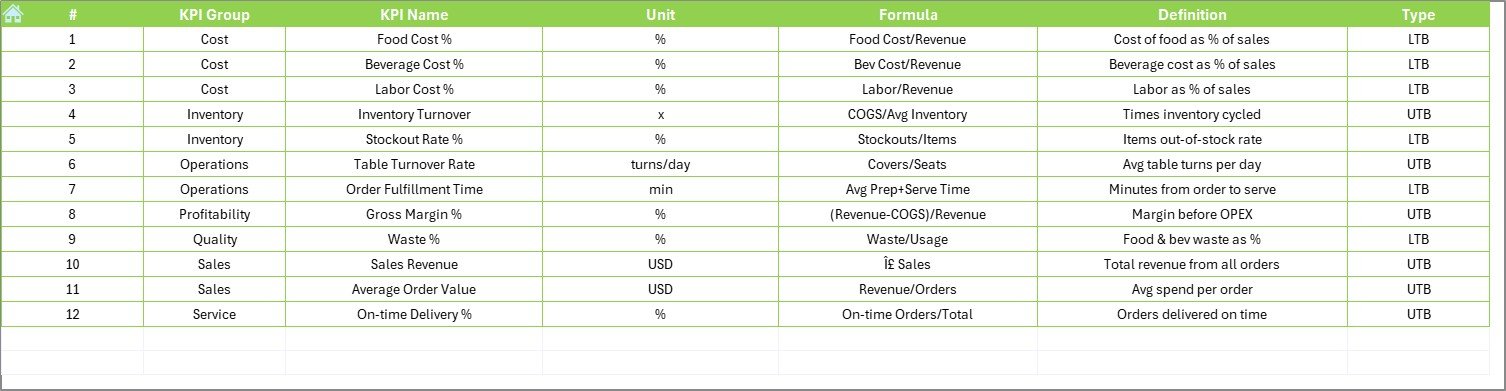
✅ KPI Clarity – Each KPI is clearly defined with unit, formula, and definition to avoid confusion across the team.
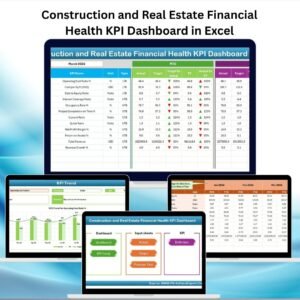
📊 What’s Inside the Food and Beverage KPI Dashboard in Excel
When you download this template, you’ll receive a fully structured Excel file with:
-
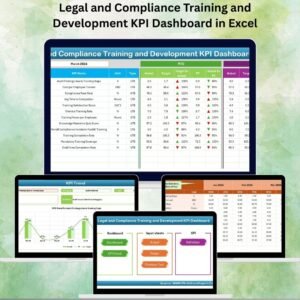
Home Page: A clean navigation menu with buttons to jump across sheets.
-
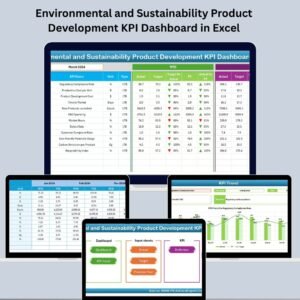
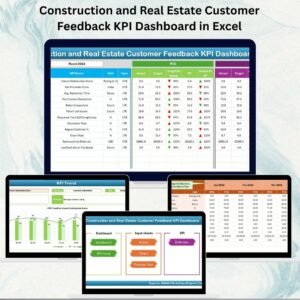
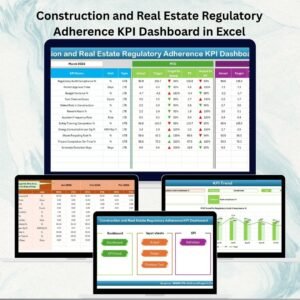
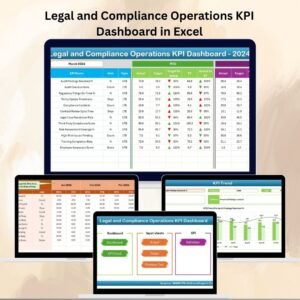
Dashboard Tab: The heart of the file, showcasing all MTD and YTD results with clear visuals.
-
KPI Trend Sheet: Dynamic KPI analysis with units, definitions, and charts.
-
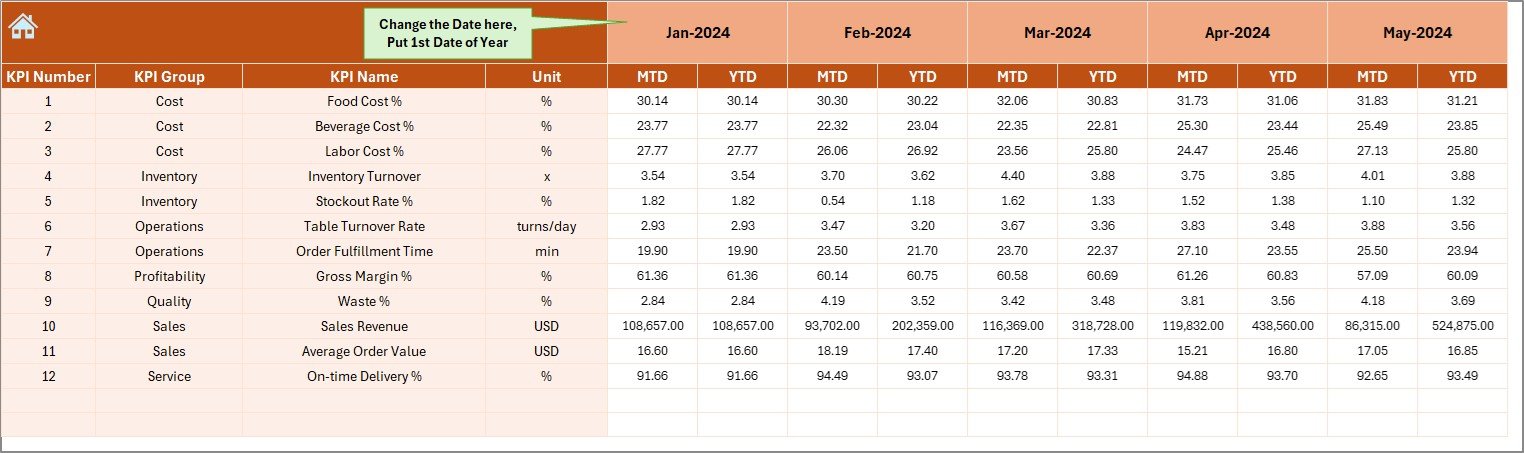
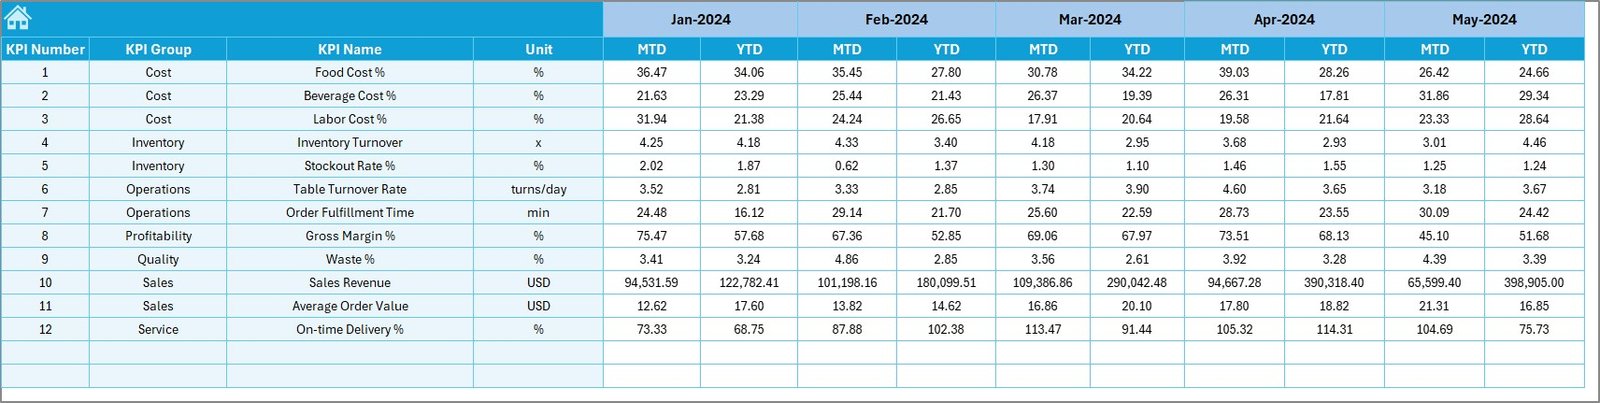
Actual Numbers Input Sheet: Easy monthly data entry section to update results.
-
Target Sheet: Set and monitor your business goals in one place.
-
Previous Year Sheet: Store historical data for benchmarking.
-
KPI Definition Sheet: Clear explanations of every KPI included in the system.
This structure ensures you never waste time searching for data or definitions — everything is organized and ready at your fingertips.
🛠️ How to Use the Food and Beverage KPI Dashboard in Excel
1️⃣ Identify Your KPIs – Choose which metrics you want to focus on (e.g., revenue, waste, labor costs, customer satisfaction).
2️⃣ Input Targets – Enter your monthly and annual goals in the Target Sheet.
3️⃣ Update Actual Data – Add monthly values in the Actual Numbers Input sheet.
4️⃣ Review the Dashboard – Instantly see comparisons of Actual vs Target and vs Previous Year with arrows and visuals.
5️⃣ Analyze Trends – Use the KPI Trend sheet to track performance over time.
6️⃣ Take Action – Adjust your operations, staffing, or inventory based on real insights.
No technical expertise required — if you know Excel, you can use this dashboard with ease!
👩🍳 Who Can Benefit from This Food and Beverage KPI Dashboard in Excel
🍽️ Restaurant Owners – Track sales, labor costs, and table turnover for better profitability.
☕ Café Managers – Monitor order values, customer satisfaction, and cost of goods.
🚚 Catering Services – Measure on-time delivery rates, food costs, and efficiency.
🏭 Food Processing Units – Control inventory turnover, waste percentage, and production costs.
🍸 Bars & Lounges – Track average order value, sales revenue, and customer experience.
📊 Consultants & Analysts – Provide actionable insights to food and beverage clients.
This dashboard is flexible and scalable — suitable for small cafés to large enterprises.
Click here to read the Detailed blog post
Visit our YouTube channel to learn step-by-step video tutorials
👉 PKAnExcelExpert


Reviews
There are no reviews yet.