


In today’s fast-paced financial technology world, success depends on how well you track, measure, and act on your data. The Fintech KPI Dashboard in Excel is your all-in-one performance tracking solution designed specifically for Fintech companies that want clarity, precision, and growth. 💹
Built entirely in Microsoft Excel, this ready-to-use, interactive dashboard empowers finance professionals, analysts, and decision-makers to monitor their business in real time. With dynamic visuals, automated calculations, and user-friendly controls, it simplifies complex financial data into clear insights that drive smart decisions.
✨ Key Features of the Fintech KPI Dashboard in Excel
💡 Comprehensive KPI Monitoring: Track all your critical financial, operational, and customer-related KPIs in one place.
📊 Dynamic MTD & YTD View: Instantly view Month-to-Date (MTD) and Year-to-Date (YTD) performance across Actual, Target, and Previous Year data.
📈 Visual Indicators: Conditional formatting with up and down arrows quickly highlights whether your KPIs are improving or declining.
🧭 Interactive Filters: Easily select months and KPIs through dropdowns to get an instant performance summary.
💼 Data Accuracy: Centralized data ensures consistency and eliminates errors caused by scattered spreadsheets.
⚙️ Automation Ready: Built with formulas and VBA capability for automatic updates, data refresh, and chart recalculations.
💰 Cost-Effective Solution: Enjoy the power of performance analytics without investing in expensive BI tools.
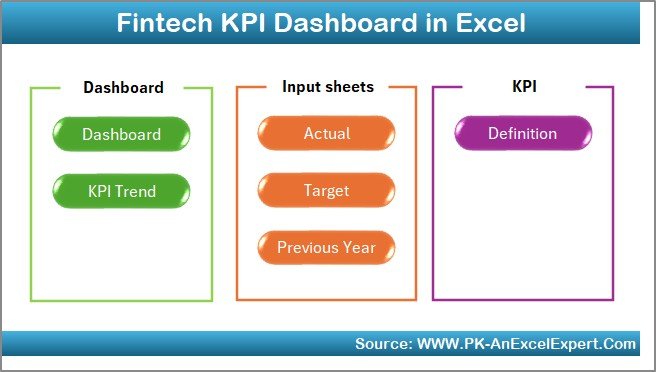
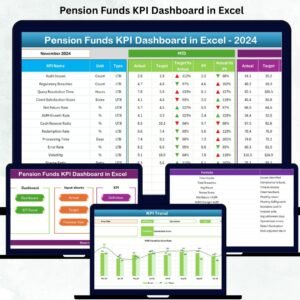
📂 What’s Inside the Fintech KPI Dashboard in Excel
This Excel dashboard includes seven fully structured worksheets, each crafted for a unique purpose:
1️⃣ Summary Page: Acts as a professional index sheet with six quick navigation buttons leading to different dashboard sections.
2️⃣ Dashboard Sheet: The main visualization tab — see all KPI results, charts, and metrics updated automatically when you select a month.
3️⃣ Trend Sheet: Displays KPI trends over time with dynamic line charts for MTD and YTD performance. Perfect for identifying patterns or anomalies.
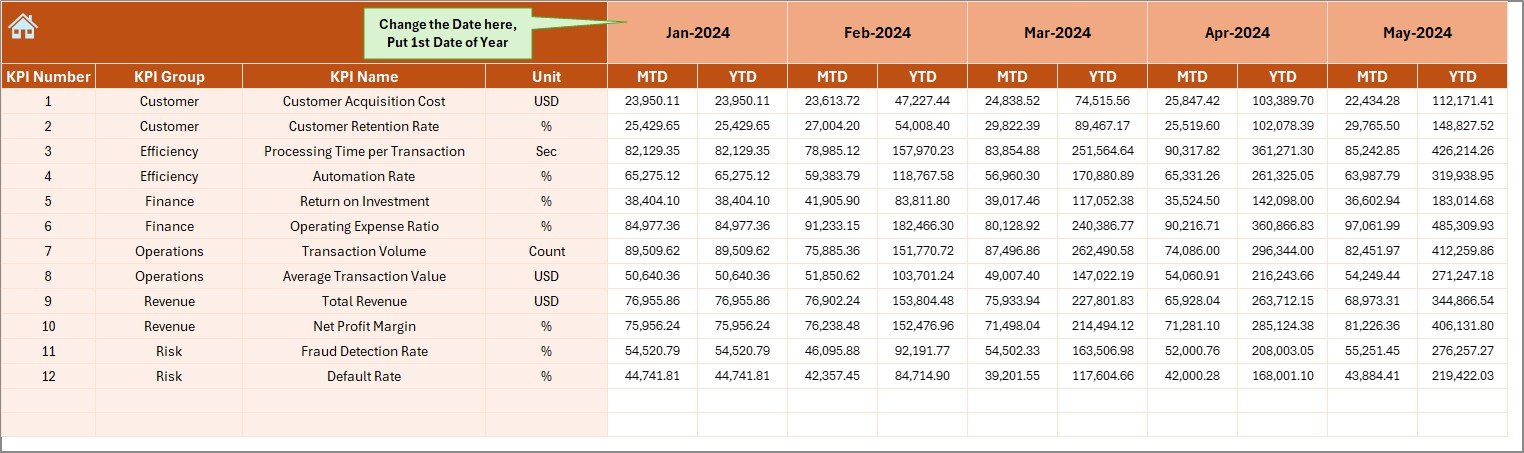
4️⃣ Actual Numbers Sheet: The data input zone where you enter monthly performance data; updates propagate instantly throughout the workbook.
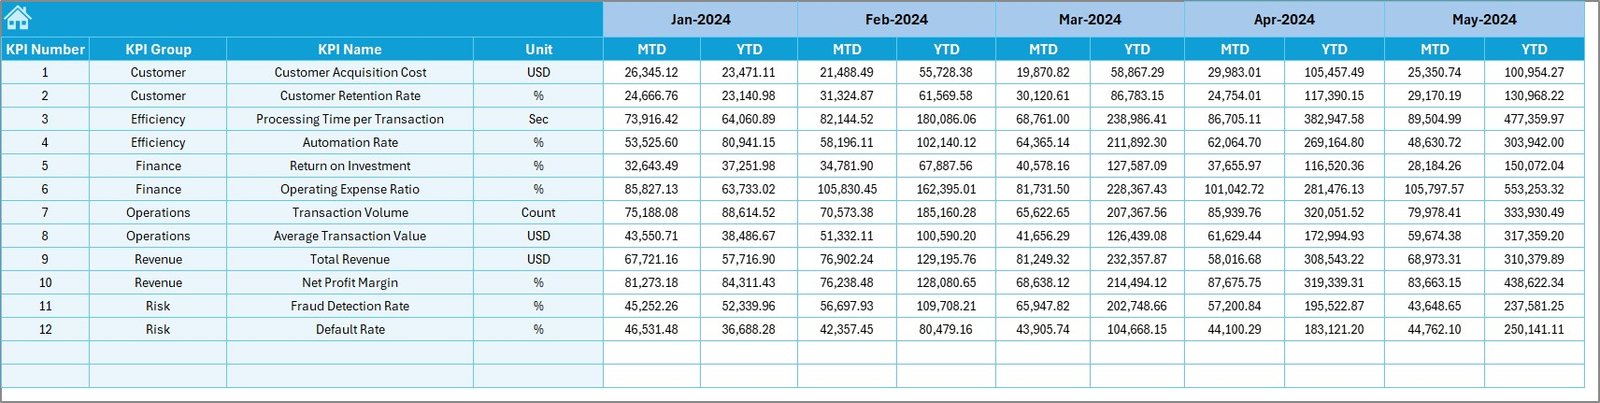
5️⃣ Target Sheet: Record your monthly and annual targets here to set benchmarks for performance tracking.
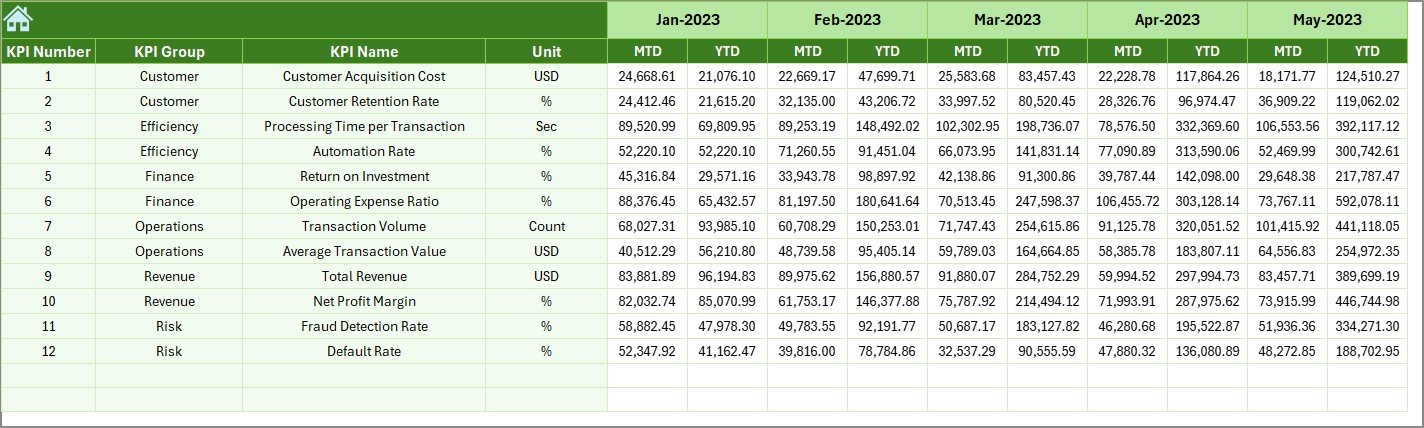
6️⃣ Previous Year Data Sheet: Keep a year-over-year comparison to analyze growth and identify gaps.
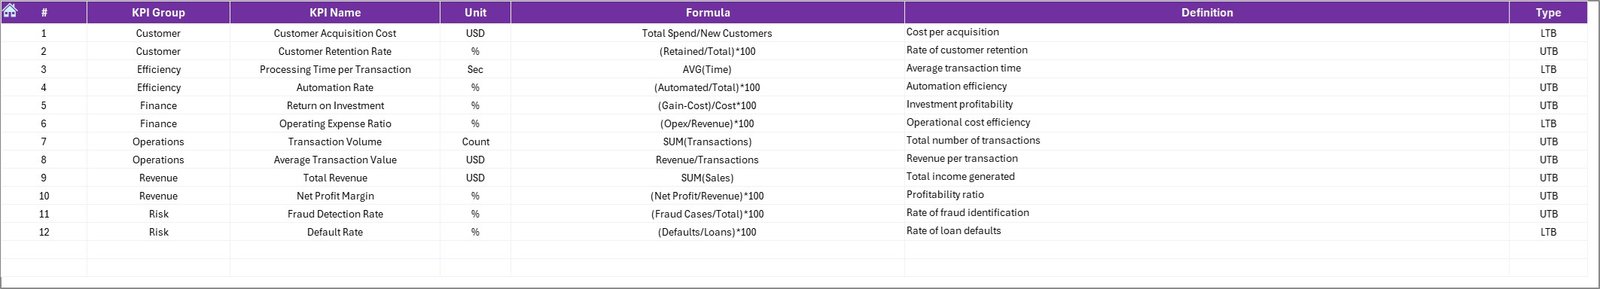
7️⃣ KPI Definition Sheet: A comprehensive list defining each KPI, its formula, unit, and whether it’s “UTB” (Upper the Better) or “LTB” (Lower the Better).
Each sheet is carefully designed to provide clarity, automation, and professional presentation — making this dashboard a must-have tool for any Fintech team.
🧠 How to Use the Fintech KPI Dashboard in Excel
Using the dashboard is simple, even for beginners:
➡️ Open the Excel file and start from the Summary Page.
➡️ Use the buttons to navigate between sheets like Dashboard, Trend, or KPI Definition.
➡️ Select a month from the dropdown (cell D3) — the entire dashboard updates automatically.
➡️ Enter your Actual, Target, and PY values in their respective sheets.
➡️ View performance instantly in charts and KPI cards.
➡️ Share the dashboard with stakeholders to make data-driven decisions.
No coding skills are required — just plug in your data and let the dashboard do the heavy lifting.
👥 Who Can Benefit from This Fintech KPI Dashboard
💼 Fintech Startups: Monitor growth, transaction volume, and performance metrics from day one.
🏦 Financial Analysts: Evaluate key metrics like profit margins, churn rate, and fraud detection trends.
📊 Executives & Investors: Access clean, visual summaries that show financial health and progress toward goals.
📱 Finance Teams: Align department targets with company objectives for better transparency.
🧑💻 Data & Compliance Officers: Keep track of regulatory compliance and system uptime efficiently.
Whether you’re managing financial operations, analyzing KPIs, or reporting to investors, this Excel-based dashboard helps you save time and make better decisions.
🔗 Click here to read the Detailed blog post
Watch the step-by-step video tutorial:
Visit our YouTube channel to learn step-by-step video tutorials. 🎥


Reviews
There are no reviews yet.