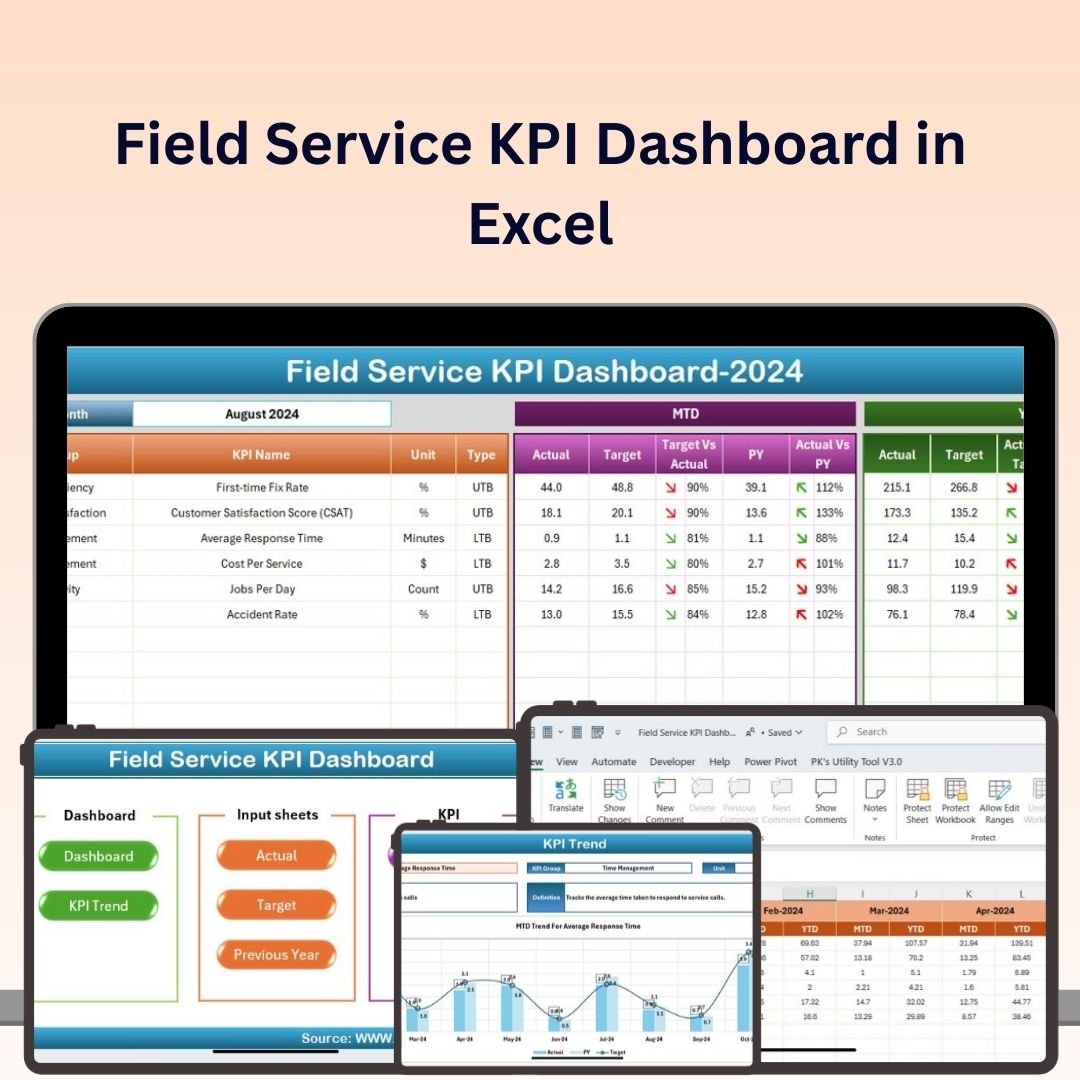
The Field Service KPI Dashboard in Excel is an essential tool designed for field service managers, operations teams, and business owners who need to track, analyze, and optimize the performance of their field service operations. This comprehensive Excel dashboard allows you to monitor key performance indicators (KPIs) like service completion rate, technician productivity, response time, and customer satisfaction, helping you streamline operations and improve service delivery.
With real-time data tracking, interactive charts, and customizable reports, this dashboard helps you ensure that your field service team is performing at its best, optimizing resource allocation, and meeting customer expectations. Whether you’re managing a small team or a large field service operation, this tool provides the insights you need to improve efficiency and drive better results.
Key Features of the Field Service KPI Dashboard in Excel:
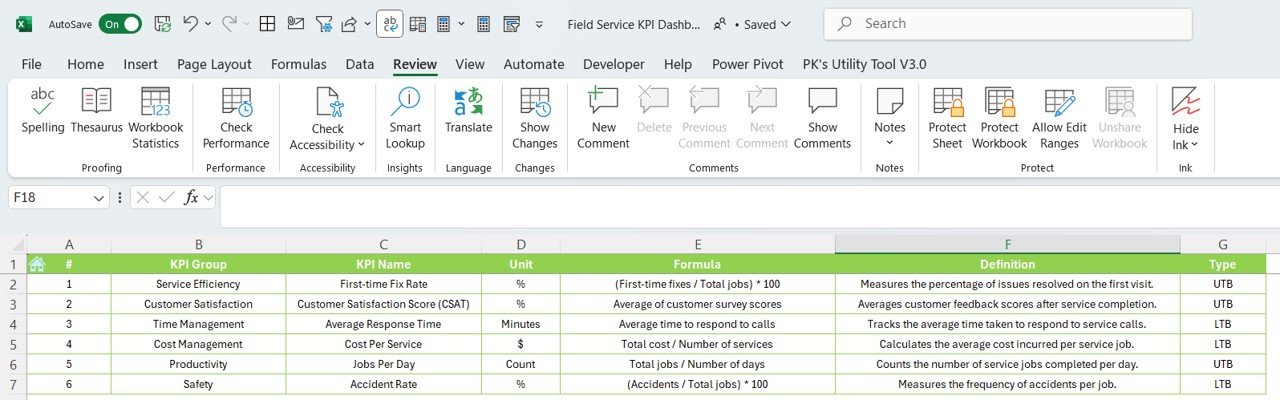
⚙️ Service Completion Rate Tracking
Track the percentage of service requests completed on time to monitor your team’s efficiency and ensure that customer expectations are met.
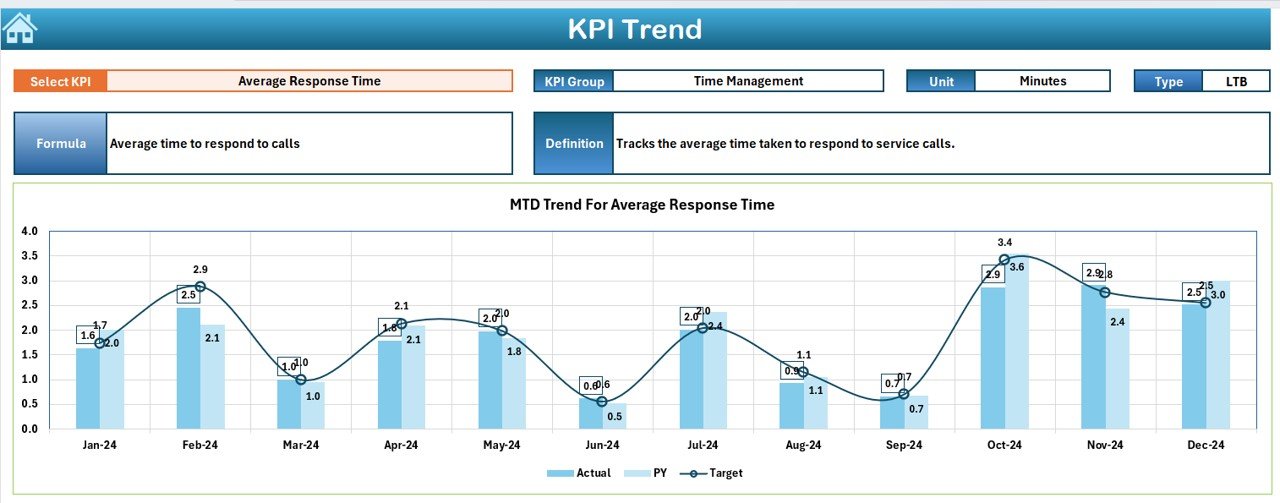
⏱ Response Time Monitoring
Measure the average time taken to respond to service requests and identify opportunities to improve response time and service delivery.
📈 Technician Productivity
Monitor technician performance, including the number of completed service calls, billable hours, and job efficiency, to ensure optimal use of your workforce.
🛠 Customer Satisfaction Tracking
Track customer satisfaction through feedback, service ratings, and repeat visits, helping you identify areas for improvement and enhance customer relationships.
💰 Cost Management and Budget Tracking
Monitor field service costs and compare them with budgeted figures to ensure that operations are running within financial limits and maximizing profitability.
🚀 Why You’ll Love the Field Service KPI Dashboard in Excel:
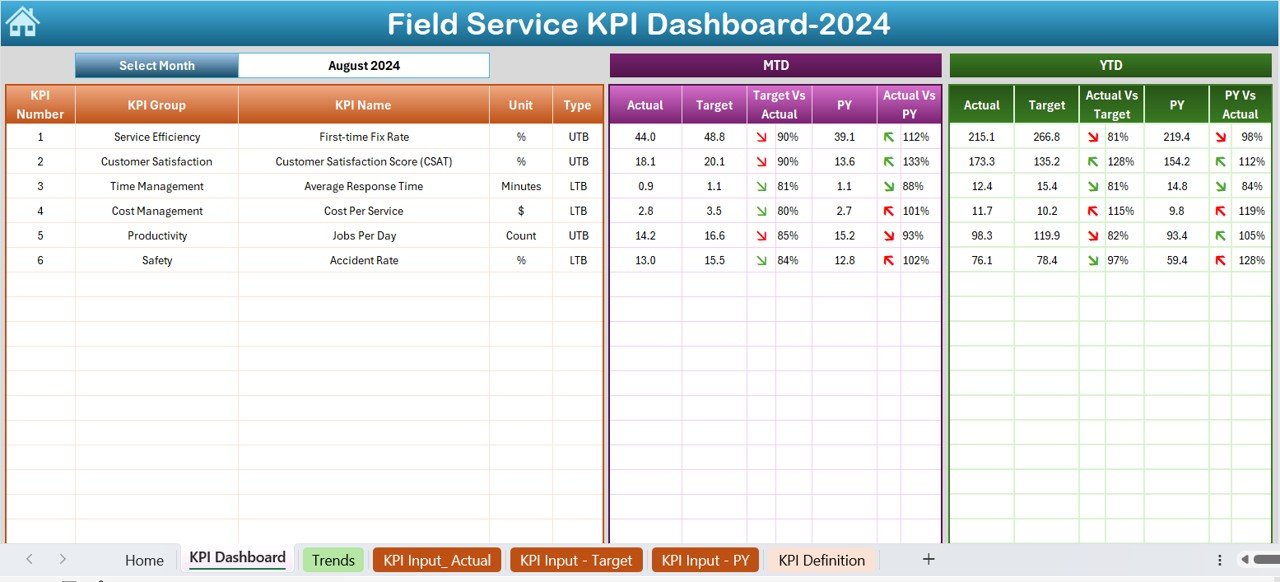
✅ Monitor Field Service Performance – Track essential KPIs like service completion rate, technician productivity, and response time to assess the effectiveness of your field service operations.
✅ Optimize Technician Efficiency – Measure technician performance and job completion rates to ensure that your team is productive and delivering quality service.
✅ Improve Customer Satisfaction – Track customer feedback, repeat visits, and service ratings to ensure that your customers are happy with the service provided.
✅ Stay Within Budget – Monitor costs associated with field service operations and compare them to budgeted expenses to ensure that you’re staying within financial limits.
✅ Customizable and Easy-to-Use – The Excel dashboard is simple to use, and you can customize it to suit the unique needs of your field service operation.
✅ Data-Driven Decisions – Use real-time data and insights to make informed decisions about resource allocation, technician performance, and service improvement strategies.
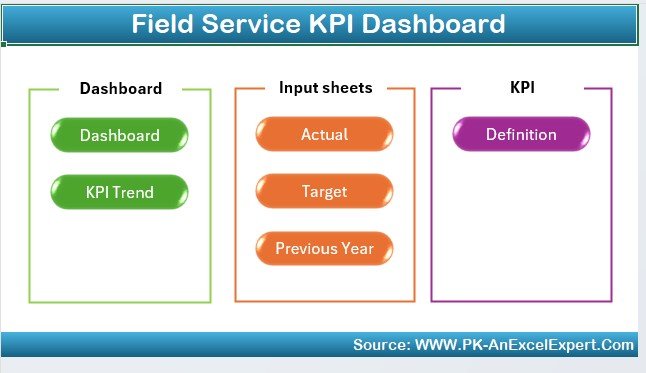
What’s Inside the Field Service KPI Dashboard in Excel:
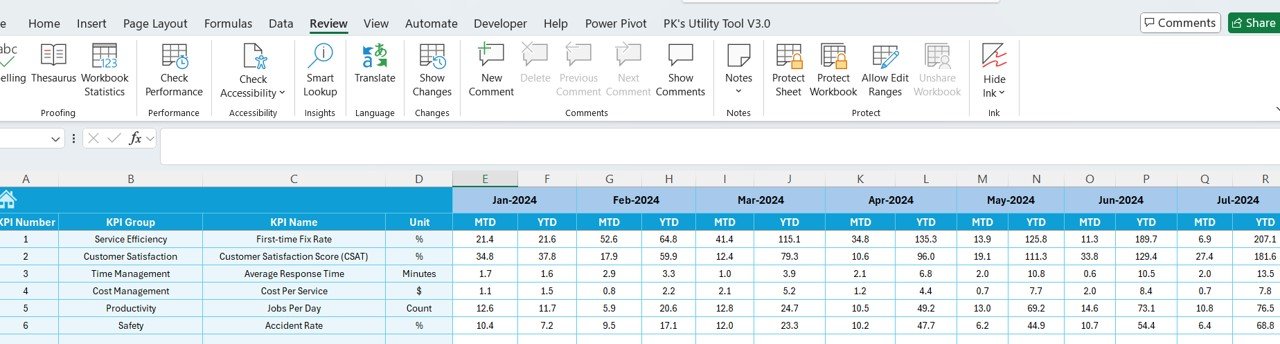
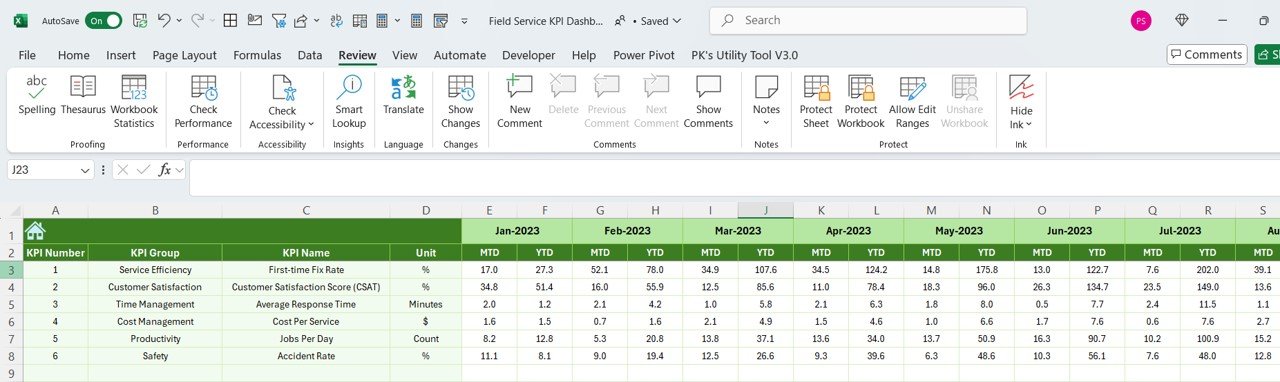
- Service Completion Rate: Track the percentage of service requests completed on time, helping you assess the efficiency and reliability of your field service team.
- Response Time Metrics: Monitor response times for service requests to identify bottlenecks and improve speed of service delivery.
- Technician Productivity: Track technician productivity through metrics like the number of completed service calls, billable hours, and efficiency ratings.
- Customer Satisfaction Scores: Measure customer satisfaction with service feedback and ratings to ensure that your team is meeting client expectations.
- Cost Tracking: Monitor operational costs associated with field service operations and compare them to budgeted amounts to ensure profitability.
- Customizable Reports: Generate custom reports and dashboards that summarize field service performance metrics for stakeholders, managers, and clients.
How to Use the Field Service KPI Dashboard in Excel:
1️⃣ Download the Template – Access your Excel file instantly upon purchase.
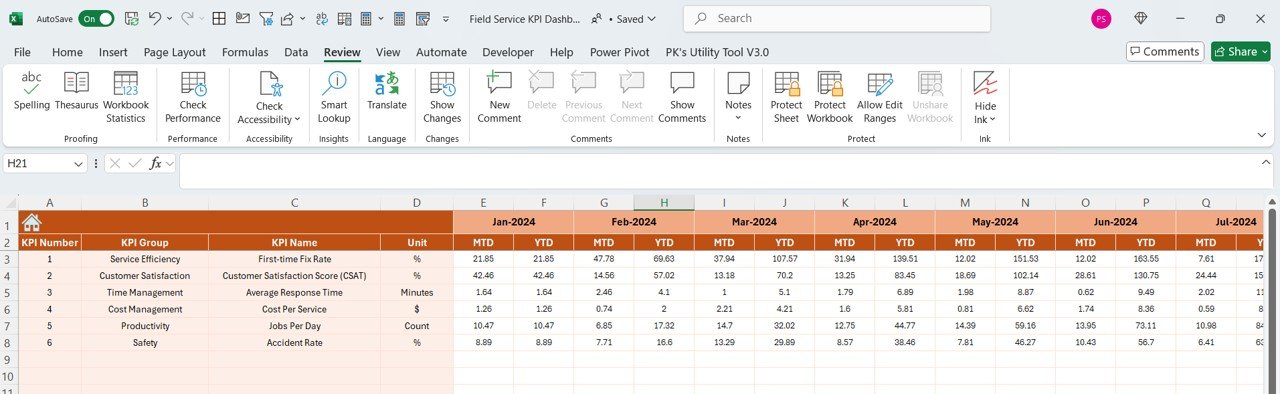
2️⃣ Enter Field Service Data – Input data such as service requests, technician performance, customer satisfaction scores, and operational costs into the dashboard.
3️⃣ Track KPIs – Monitor key metrics like service completion rate, response time, and technician productivity in real time.
4️⃣ Analyze Trends – Use the dashboard’s interactive charts to analyze trends in response times, productivity, and customer satisfaction.
5️⃣ Generate Reports – Create customized reports to communicate field service performance to stakeholders, managers, or clients.
Who Can Benefit from the Field Service KPI Dashboard in Excel:
- Field Service Managers
- Operations Managers
- Service Coordinators
- Technicians and Team Leaders
- Business Owners in Field Service Operations
- Data Analysts in Service Industries
- Customer Service Managers
- Financial Analysts in Service Industries
The Field Service KPI Dashboard in Excel is the perfect tool for any business looking to improve field service efficiency, optimize technician productivity, and enhance customer satisfaction. Whether you manage a small team or oversee a large field service operation, this tool gives you the insights you need to streamline operations and improve results.
Click here to read the Detailed blog post
https://www.pk-anexcelexpert.com/field-service-kpi-dashboard-in-excel/
Visit our YouTube channel to learn step-by-step video tutorials
Youtube.com/@PKAnExcelExpert


Reviews
There are no reviews yet.