
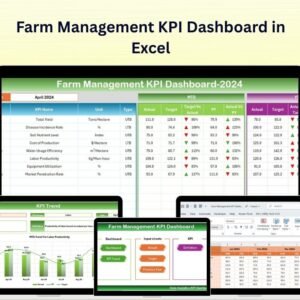
The Farm Management KPI Dashboard in Excel is a powerful tool designed for farm managers, agricultural consultants, and farm owners to monitor and optimize farm operations. Whether you’re managing a small family farm or a large-scale agricultural operation, this Excel-based dashboard provides essential insights into key performance indicators (KPIs) such as crop yield, labor productivity, financial performance, equipment usage, and resource allocation.
With customizable features and real-time tracking, this dashboard allows you to make data-driven decisions, improve operational efficiency, and ensure the sustainability of your farming practices.

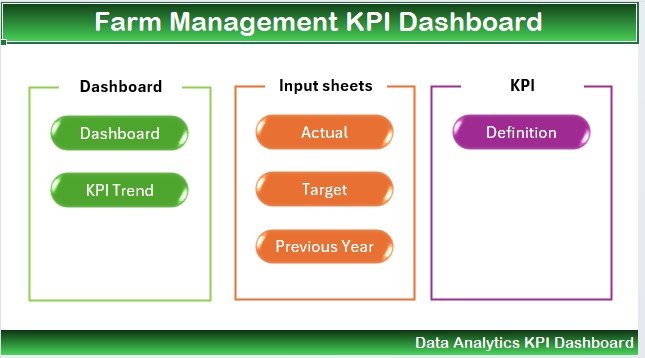
Key Features of the Farm Management KPI Dashboard in Excel:
🌱 Crop Yield and Production Tracking
Track the yield of various crops, monitor production rates, and analyze harvest trends to ensure optimal agricultural output and productivity.
💰 Revenue and Financial Performance
Monitor income from crop sales, livestock, and other agricultural activities, assess expenses, and calculate profitability to ensure the farm’s financial health.
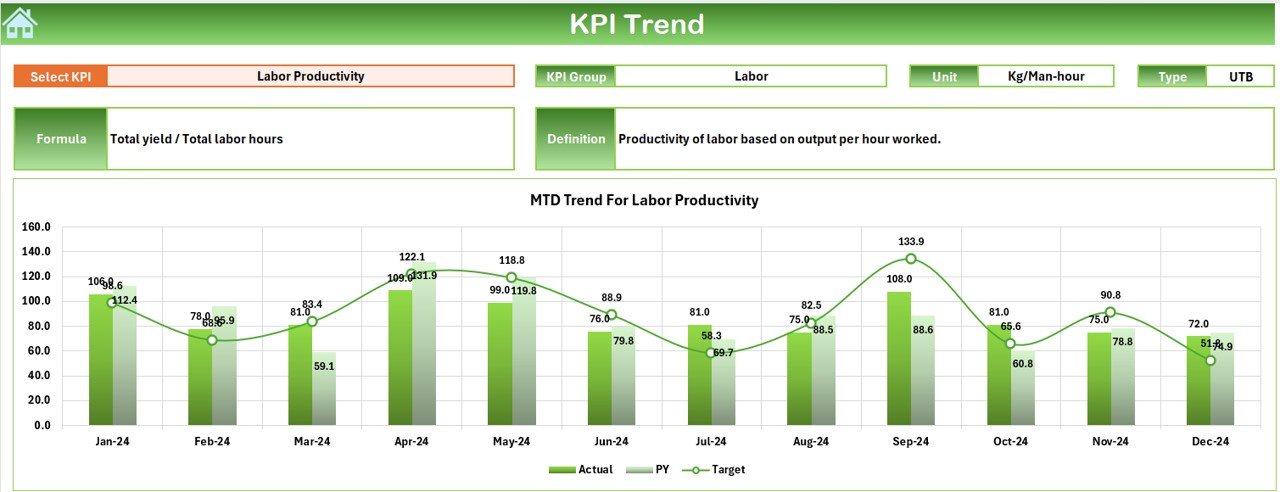
👩🌾 Labor and Productivity Management
Track labor hours, workforce productivity, and task completion to ensure efficient use of labor and reduce unnecessary costs.
🚜 Equipment Utilization
Track equipment usage, maintenance schedules, and downtime to ensure that machinery is being utilized effectively and minimize costly repairs.
📊 Resource Allocation
Monitor water usage, fertilizer application, and other resources to ensure that inputs are used efficiently and sustainably.
🚀 Why You’ll Love the Farm Management KPI Dashboard in Excel:
✅ Track Crop and Livestock Yield – Monitor crop and livestock production, track yield trends, and assess the effectiveness of farming practices.
✅ Monitor Financial Health – Track income, expenses, and profitability from various agricultural activities to ensure a financially sustainable operation.
✅ Optimize Labor Productivity – Track labor hours and workforce performance to ensure efficient use of human resources and reduce costs.
✅ Manage Equipment Effectively – Monitor equipment usage, downtime, and maintenance to optimize machine productivity and extend equipment life.
✅ Ensure Resource Efficiency – Track resource usage, such as water and fertilizers, to ensure sustainability and cost-effective farming practices.
✅ Fully Customizable and Interactive – Tailor the dashboard to meet your farm’s specific needs, with interactive features for real-time insights and data tracking.
What’s Inside the Farm Management KPI Dashboard in Excel:
-
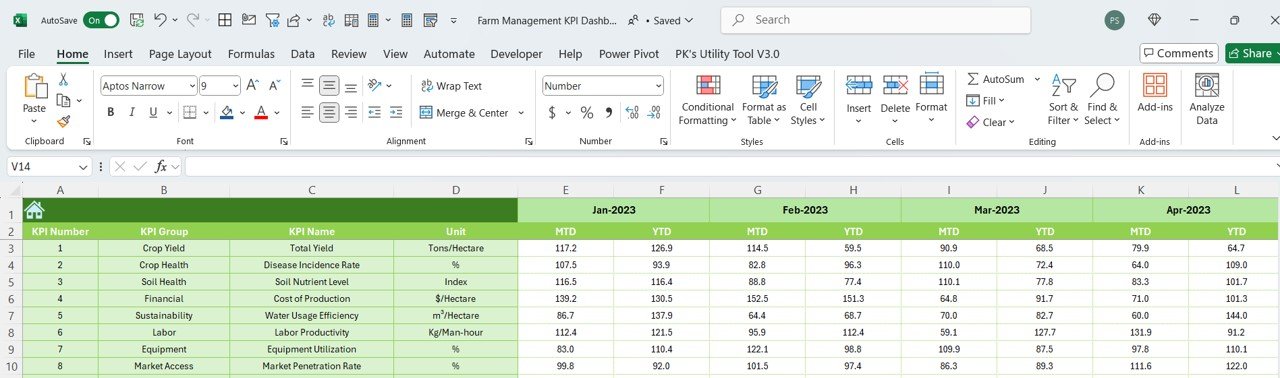
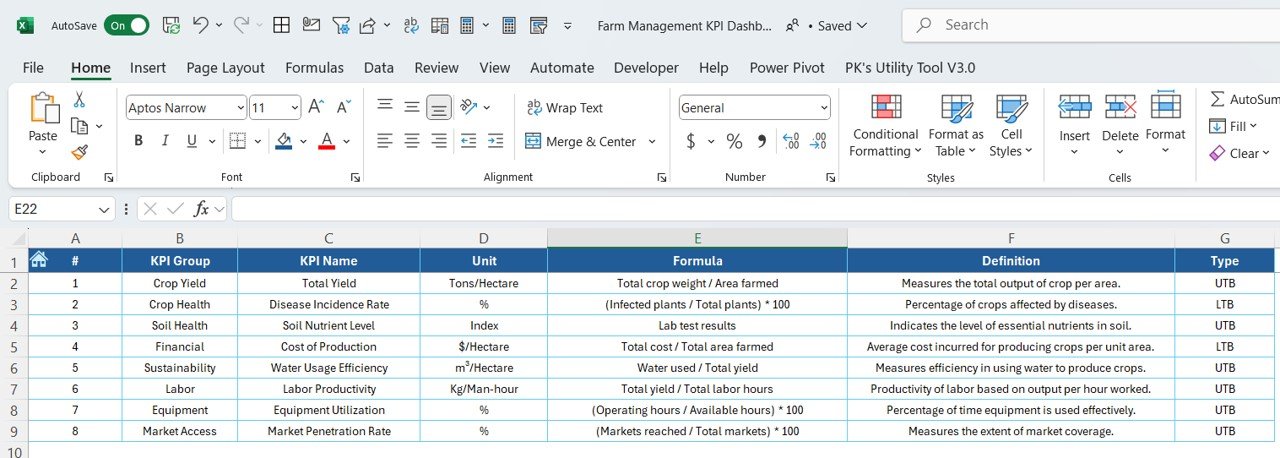
Crop Yield Tracking: Track the yield of different crops, monitor harvest data, and analyze trends to improve farming productivity.
-
Financial Performance: Track revenue from crop sales, livestock, and farm-related activities while monitoring operational expenses and profitability.
-
Labor Productivity: Track labor hours, task completion, and workforce efficiency to ensure that labor resources are used effectively.
-
Equipment Utilization: Monitor machinery usage, downtime, and maintenance schedules to optimize equipment performance and minimize repair costs.
-
Resource Usage Monitoring: Track water, fertilizer, and other resource inputs to optimize usage and ensure sustainability.
-
Custom Reports: Generate reports summarizing key performance metrics such as crop yield, revenue, labor productivity, and equipment usage to inform decision-making.
How to Use the Farm Management KPI Dashboard in Excel:
1️⃣ Download the Template – Instantly access your Excel file upon purchase.
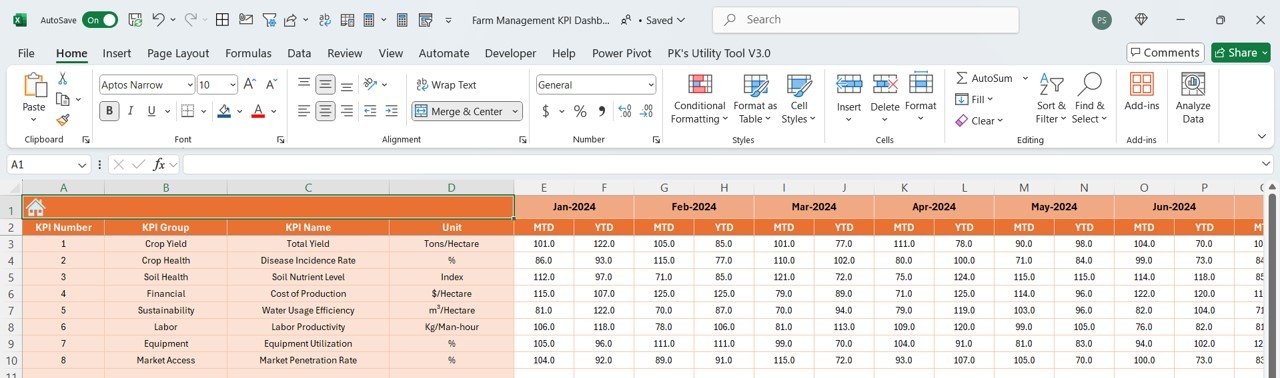
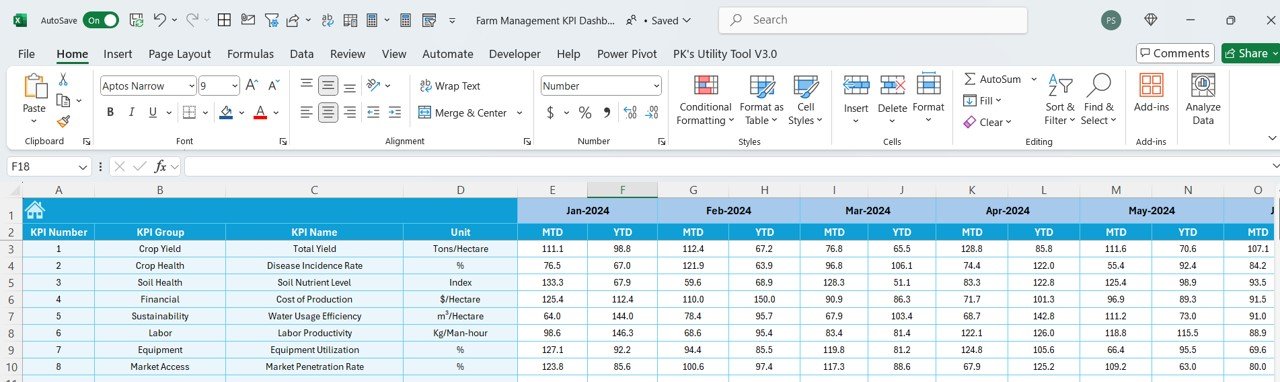
2️⃣ Input Farm Data – Enter data such as crop yield, labor hours, revenue, and resource usage to begin tracking KPIs.
3️⃣ Monitor Key Metrics – Use the dashboard to track crop yield, financial performance, labor productivity, and resource usage in real-time.
4️⃣ Evaluate Financials – Track revenue, expenses, and profitability to ensure financial sustainability.
5️⃣ Generate Reports – Create detailed reports summarizing farm performance metrics to inform business strategies and improve decision-making.
Who Can Benefit from the Farm Management KPI Dashboard in Excel:
-
Farm Owners and Managers
-
Agricultural Consultants
-
Crop and Livestock Farmers
-
Financial Analysts in Agriculture
-
Equipment Managers
-
Farm Operations Teams
-
Resource Management Teams
-
Sustainability Officers in Agriculture
-
Agricultural Economists
The Farm Management KPI Dashboard in Excel is an ideal tool for managing and optimizing all aspects of farm operations. By tracking key performance metrics such as crop yield, financial performance, labor productivity, and resource usage, this dashboard helps ensure your farming operation is both profitable and sustainable.
Click here to read the Detailed blog post
https://www.pk-anexcelexpert.com/farm-management-kpi-dashboard-in-excel/
Visit our YouTube channel to learn step-by-step video tutorials
Youtube.com/@PKAnExcelExpert


Reviews
There are no reviews yet.