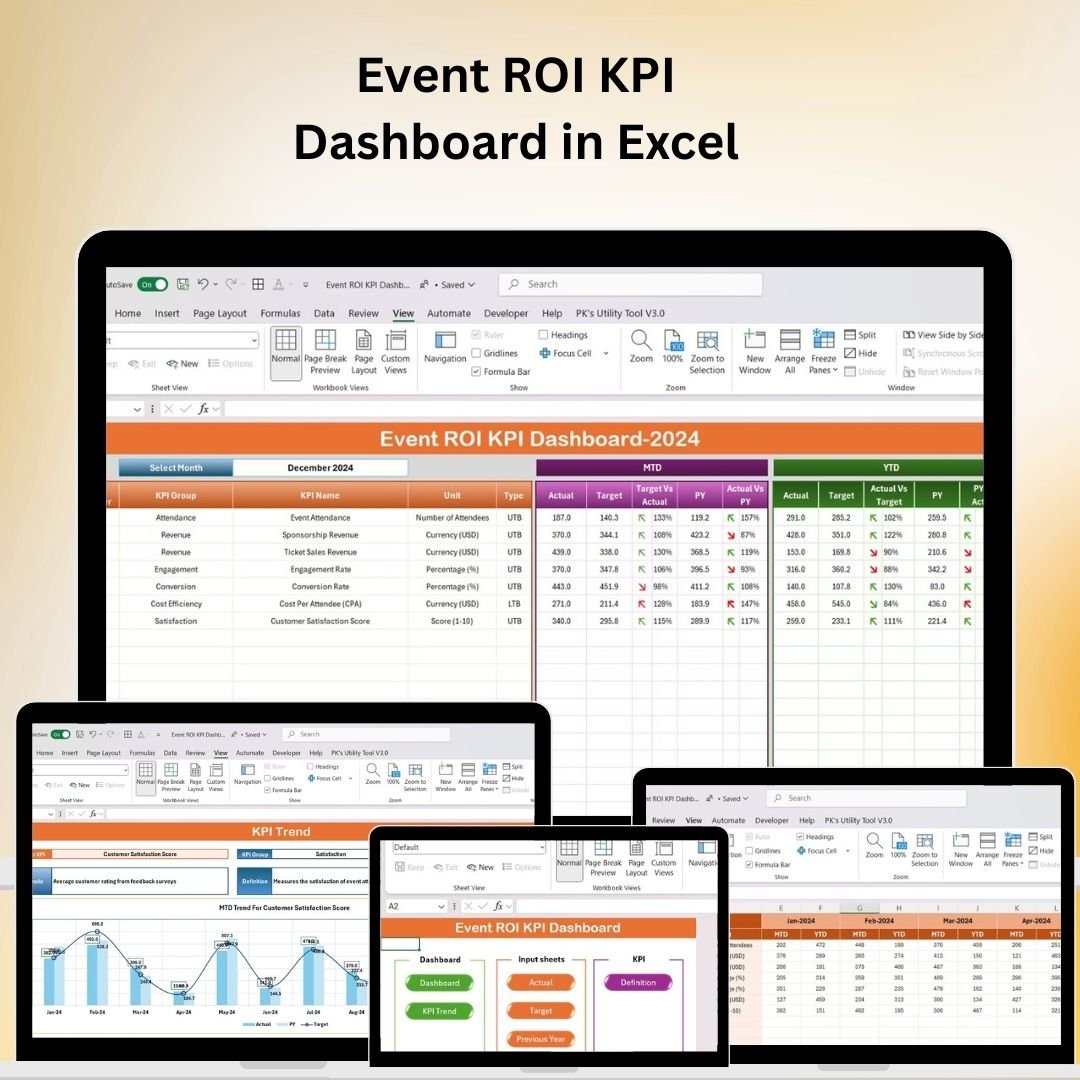


The Event ROI KPI Dashboard in Excel is an essential tool for event organizers, marketers, and business managers looking to measure and analyze the return on investment (ROI) of their events. This Excel-based dashboard provides an insightful way to track key performance indicators (KPIs) such as event attendance, revenue, engagement, and overall event performance, allowing you to evaluate the success of your events in a structured and actionable way.
By monitoring your event’s ROI, you can identify areas for improvement, adjust your strategies, and ensure that your future events are even more successful. This dashboard offers easy-to-use features and visual representations of event data to help you make data-driven decisions that will maximize your event’s impact and profitability.
Key Features of the Event ROI KPI Dashboard in Excel
📊 Comprehensive KPI Tracking
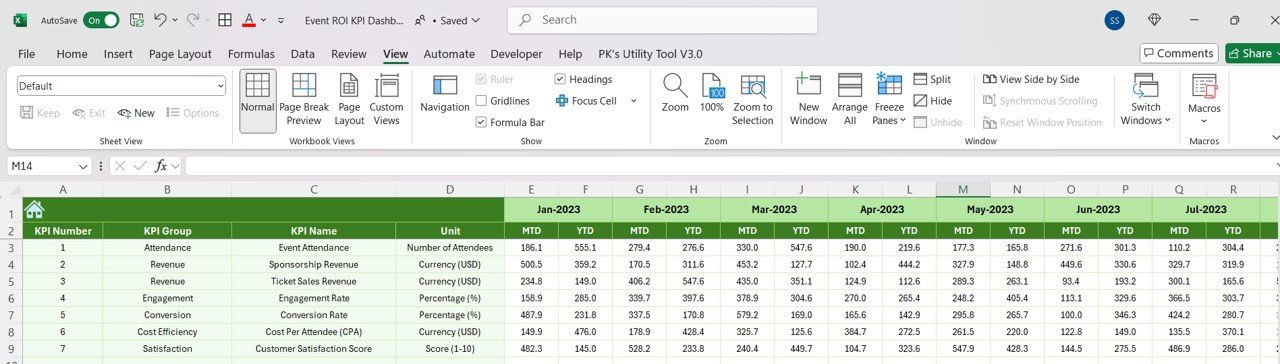
Track essential KPIs such as attendance, ticket sales, sponsorship revenue, and post-event engagement. Analyze these metrics to evaluate your event’s financial and operational success.
💰 Revenue & Cost Analysis
Monitor your event’s revenue streams (ticket sales, sponsorships, merchandise) and compare them with event costs to determine the event’s profitability.
📈 Engagement Metrics
Measure attendee engagement through metrics like social media interactions, survey responses, and participant feedback, giving you a holistic view of your event’s impact.
🎯 Goal Tracking & Performance Comparison
Set event-specific goals and track performance against these goals. Use this data to assess the effectiveness of your marketing, operational strategies, and event execution.
🔄 Customizable KPIs & Metrics
Tailor the dashboard to your specific event needs. Add custom KPIs or adjust existing metrics to reflect the unique goals of your event.
📅 Time-Based Performance Analysis
Track your event’s performance across different time periods (before, during, and after the event) to analyze trends and improve future events.
Why You’ll Love the Event ROI KPI Dashboard in Excel

✅ Measure Event Success
Track and analyze critical metrics such as attendance, engagement, and revenue to evaluate the success of your event.
✅ Increase Event Profitability
By tracking event revenue against costs, you can identify areas for improvement and optimize future event budgets for higher profitability.
✅ Improve Event Planning & Execution
Use the insights from the dashboard to refine your event planning process, streamline operations, and enhance attendee engagement.
✅ Optimize Marketing Efforts
Evaluate the effectiveness of your marketing campaigns by analyzing metrics like social media engagement and attendee feedback, helping you improve future event promotions.
✅ Customizable & Scalable
Customize the dashboard to suit the specific needs of your event, whether you’re planning a small seminar or a large-scale conference. It’s scalable to fit any event size.
What’s Inside the Event ROI KPI Dashboard in Excel?
-
Comprehensive KPI Tracking: Track event attendance, ticket sales, revenue, and more.
-
Revenue & Cost Analysis: Monitor your event’s profitability by comparing income to expenses.
-
Engagement Metrics: Measure attendee engagement through social media interactions and feedback.
-
Goal Tracking: Set goals and compare your event’s performance against them.
-
Time-Based Performance Analysis: Analyze event performance across different stages and time periods.
-
Customizable Features: Tailor the dashboard to your event’s specific needs.
How to Use the Event ROI KPI Dashboard in Excel
1️⃣ Download the Template: Instantly access the Event ROI KPI Dashboard in Excel.
2️⃣ Input Event Data: Enter your event’s key data, including attendance, ticket sales, and sponsorship revenue.
3️⃣ Track KPIs & Performance: Monitor key metrics and compare performance against set goals.
4️⃣ Analyze Revenue & Costs: Use the revenue and cost analysis to calculate your event’s ROI.
5️⃣ Optimize Future Events: Use the insights to improve future events, increasing engagement and profitability.
Who Can Benefit from the Event ROI KPI Dashboard in Excel?
🔹 Event Organizers & Coordinators
🔹 Marketing Teams & Event Planners
🔹 Business Owners & Entrepreneurs
🔹 Conference & Seminar Organizers
🔹 Corporate Event Managers
🔹 Non-Profit Organizations & Fundraisers
🔹 Anyone Looking to Improve Event Performance
Track the success of your events and make data-driven decisions with the Event ROI KPI Dashboard in Excel. Analyze revenue, engagement, and performance to ensure that every event you plan delivers maximum value.
Click here to read the Detailed blog post
Visit our YouTube channel to learn step-by-step video tutorials
Youtube.com/@PKAnExcelExpert


Reviews
There are no reviews yet.