
In today’s environmentally conscious world, organizations must do more than just promote green initiatives—they must actively train, track, and improve how their teams contribute to sustainability. That’s where the Environmental and Sustainability Training and Development KPI Dashboard in Excel comes in.
This ready-to-use Excel tool is designed for HR teams, sustainability officers, and training coordinators who want to align their corporate training programs with ESG (Environmental, Social, Governance) objectives. Whether you’re running a compliance-driven enterprise or an agile eco-focused team, this dashboard transforms your training data into actionable insights.
📘 What is this Dashboard All About?
The Environmental and Sustainability Training KPI Dashboard is an Excel-based analytics solution that enables:
-
Tracking of monthly and yearly performance of green training initiatives
-
Measurement of KPIs such as Completion Rate, Assessment Score, Hours Trained, and more
-
Easy-to-navigate worksheet structure for seamless updates and reviews
-
Comparison of current progress with targets and previous year data
It ensures your training outcomes are measurable, repeatable, and aligned with your sustainability mission.
📌 Key Features of the Excel Dashboard Template
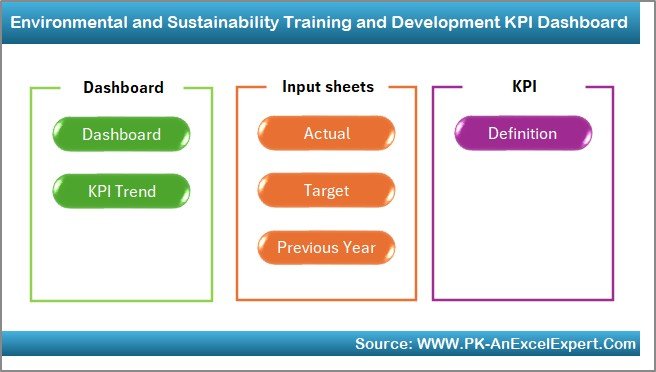
This robust template contains 7 automated worksheet tabs:
1️⃣ Home Sheet: Central navigation hub with buttons for quick access
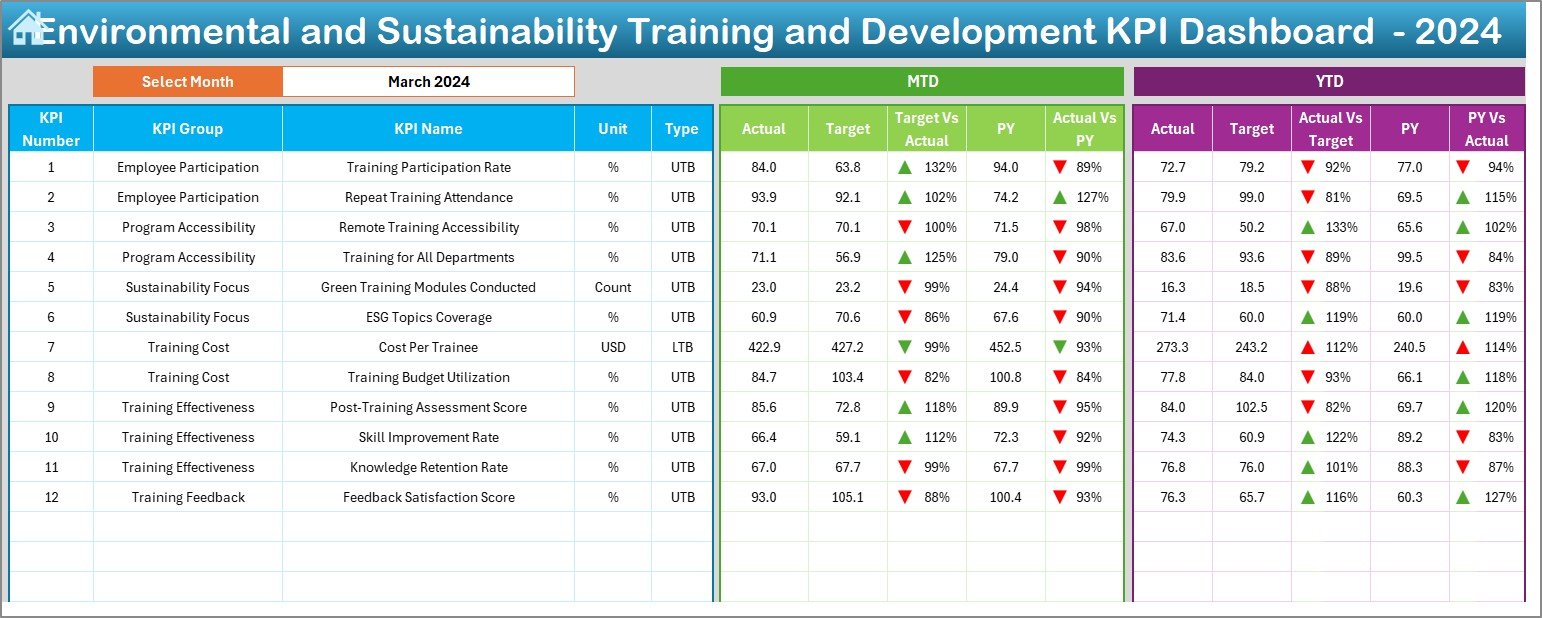
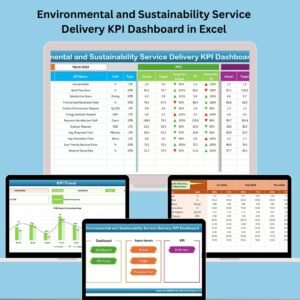
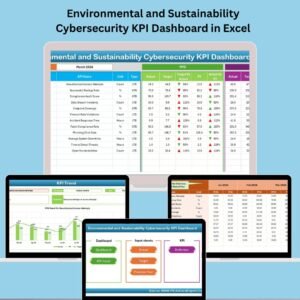
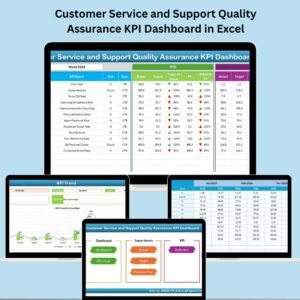
2️⃣ Dashboard Sheet: Dynamic charts for MTD/YTD Actuals vs Target vs PY with arrows
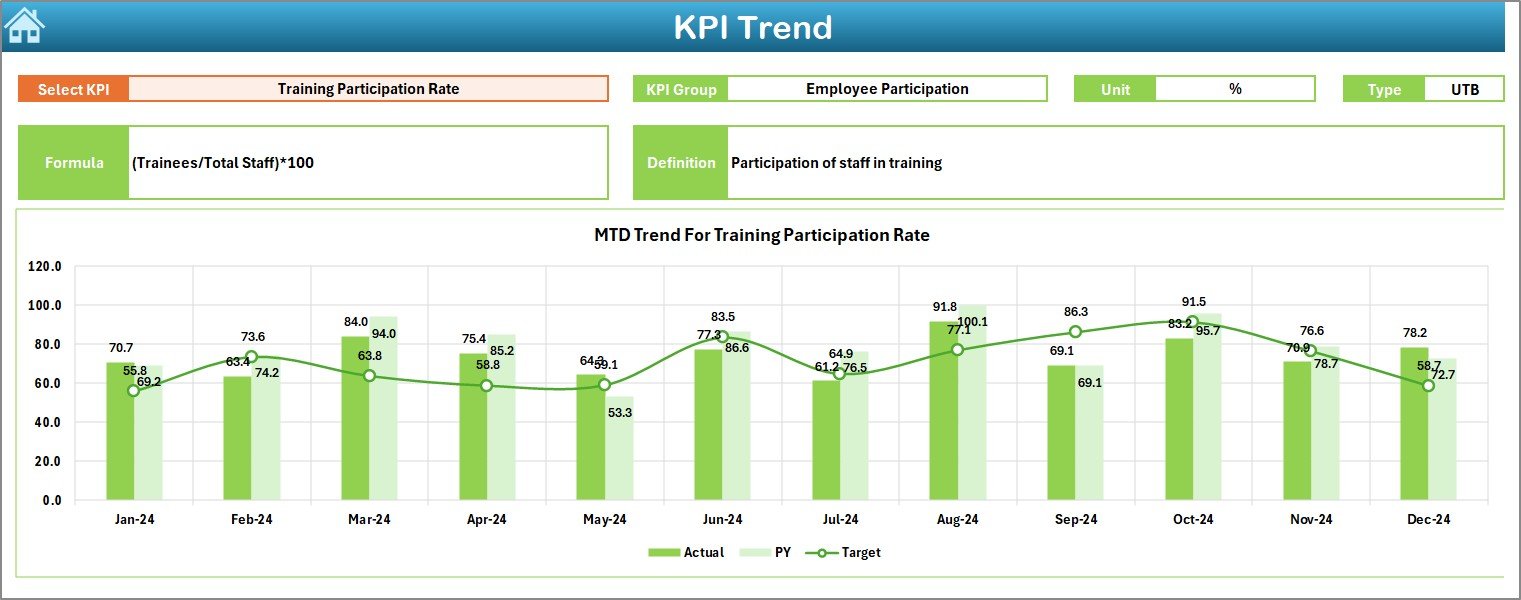
3️⃣ KPI Trend Sheet: Track long-term performance with dropdown-based visuals
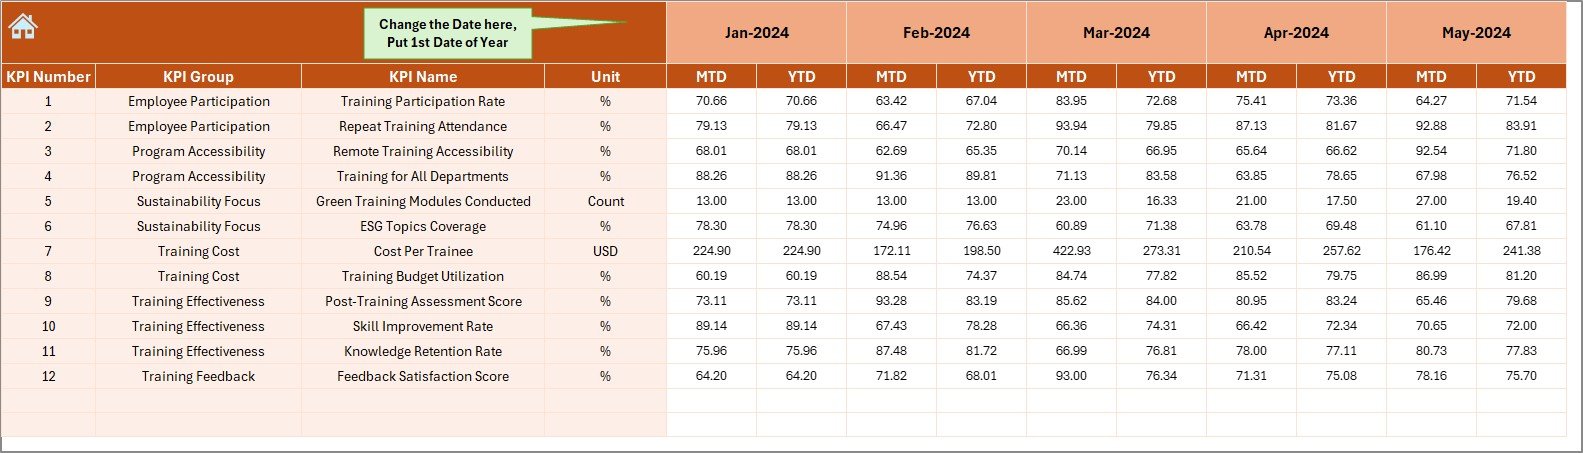
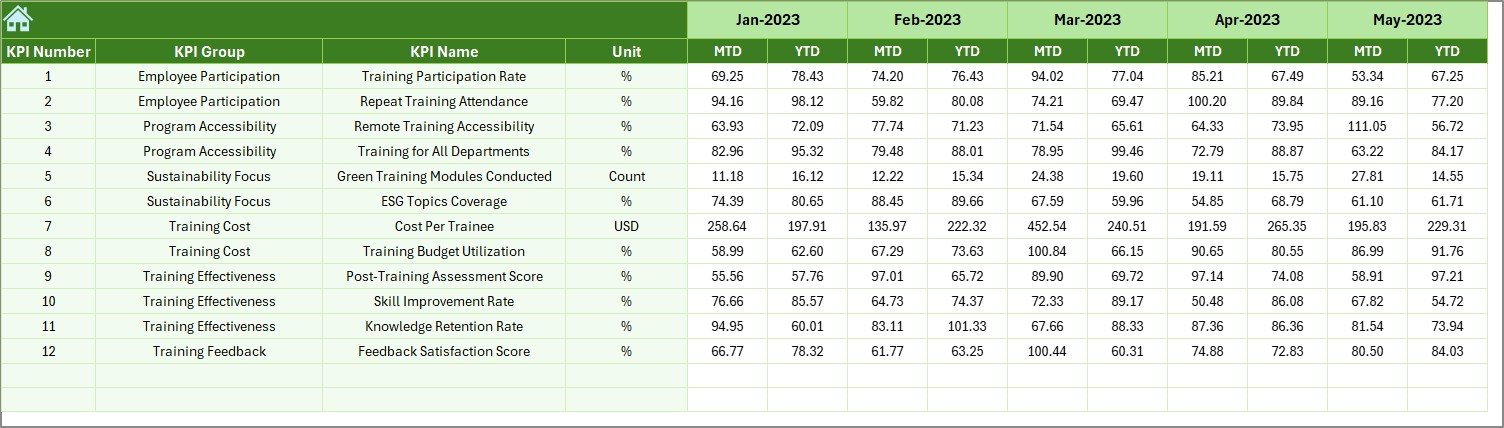
4️⃣ Actual Numbers Input: Enter monthly data and adjust start of fiscal year
5️⃣ Target Sheet: Set ambitious yet achievable targets for every KPI
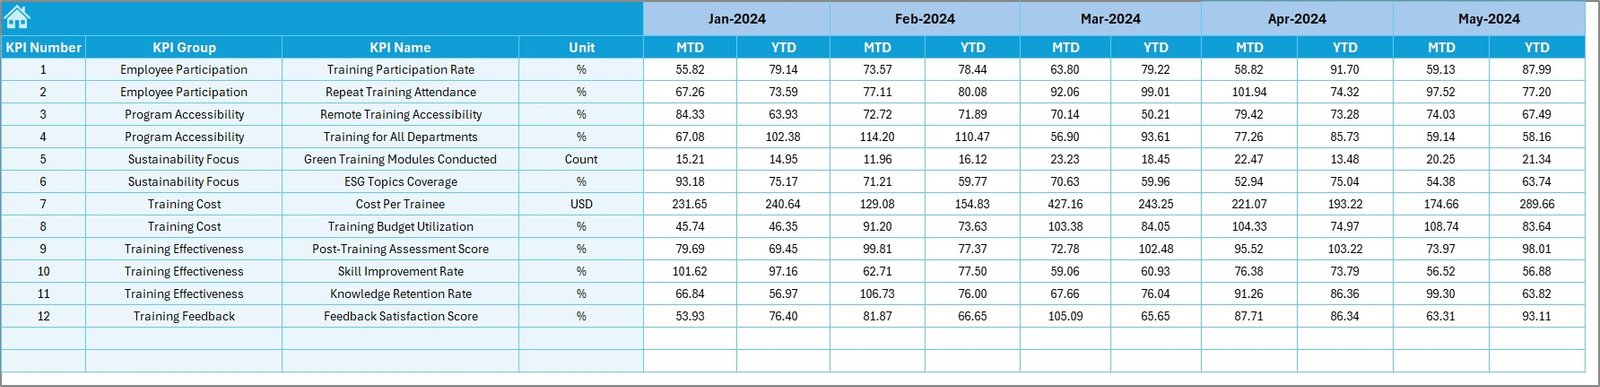
6️⃣ Previous Year Sheet: Record historical data for YoY comparisons
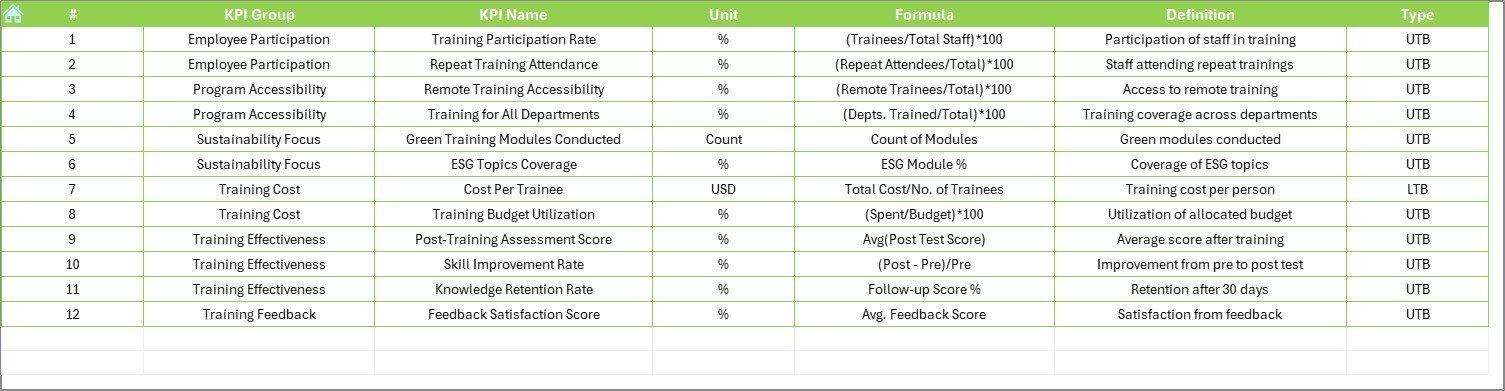
7️⃣ KPI Definition Sheet: Maintain clarity with unit, type, and formulas
🌍 KPIs Tracked in This Dashboard
Below are some of the most useful KPIs for sustainability-focused training:
-
Number of Employees Trained on Sustainability Topics
-
Training Completion Rate
-
Environmental Compliance Coverage
-
Average Training Hours per Employee
-
Post-Training Assessment Scores
-
Percentage of Green-Certified Programs
-
Trainer Effectiveness Score
-
Cost per Sustainability Training
-
Engagement Rate in Eco-Initiatives
Each KPI is labeled as either UTB (Upper the Better) or LTB (Lower the Better).
💡 Key Benefits for Your Organization
✅ Aligns training with corporate sustainability goals
✅ Simplifies monthly tracking and reporting
✅ Improves decision-making through trend analysis
✅ Ensures accountability at department/team level
✅ Minimizes Excel learning curve with ready formulas and buttons
✅ Supports ESG reporting and ISO 14001 compliance
🎯 Best Practices for Maximum Impact
-
📆 Update monthly data in Actual, Target, and Previous Year sheets
-
🔄 Use dropdowns to filter specific KPIs in trend analysis
-
🔐 Assign responsibility for each KPI to ensure ownership
-
📈 Review dashboard quarterly to assess performance
-
🧩 Customize KPI types, colors, or department filters as needed
-
🗂 Validate your data source (HRMS, LMS, etc.) for accuracy
💬 Who Should Use This Dashboard?
-
Corporate Sustainability Officers
-
HR & Learning Development Teams
-
ESG Compliance Analysts
-
Environmental Managers
-
Training Coordinators
Whether you’re reporting to senior leadership or improving team awareness, this tool helps you track, evaluate, and communicate performance efficiently.
📥 What’s Included?
-
Fully automated Excel dashboard with 7 linked sheets
-
KPI metadata structure and editable formulas
-
Visuals with real-time arrows and dropdown filters
-
Instructional YouTube tutorial: youtube.com/@PKAnExcelExpert
🔗 Click here to read the Detailed blog post


Reviews
There are no reviews yet.