
The Energy Storage KPI Dashboard in Excel is a powerful tool designed to help energy storage providers, managers, and businesses track, monitor, and optimize their energy storage systems’ performance. Whether you’re working with batteries, solar energy storage, or other energy solutions, this dashboard offers insights into key performance indicators (KPIs) such as energy stored, energy released, charge/discharge cycles, and system efficiency.
With this Excel-based dashboard, you can easily track storage capacities, monitor energy usage, and analyze performance over time. The dashboard’s intuitive interface and data visualization features make it easier for businesses to make informed decisions and improve the efficiency of their energy storage operations.
Key Features of the Energy Storage KPI Dashboard in Excel
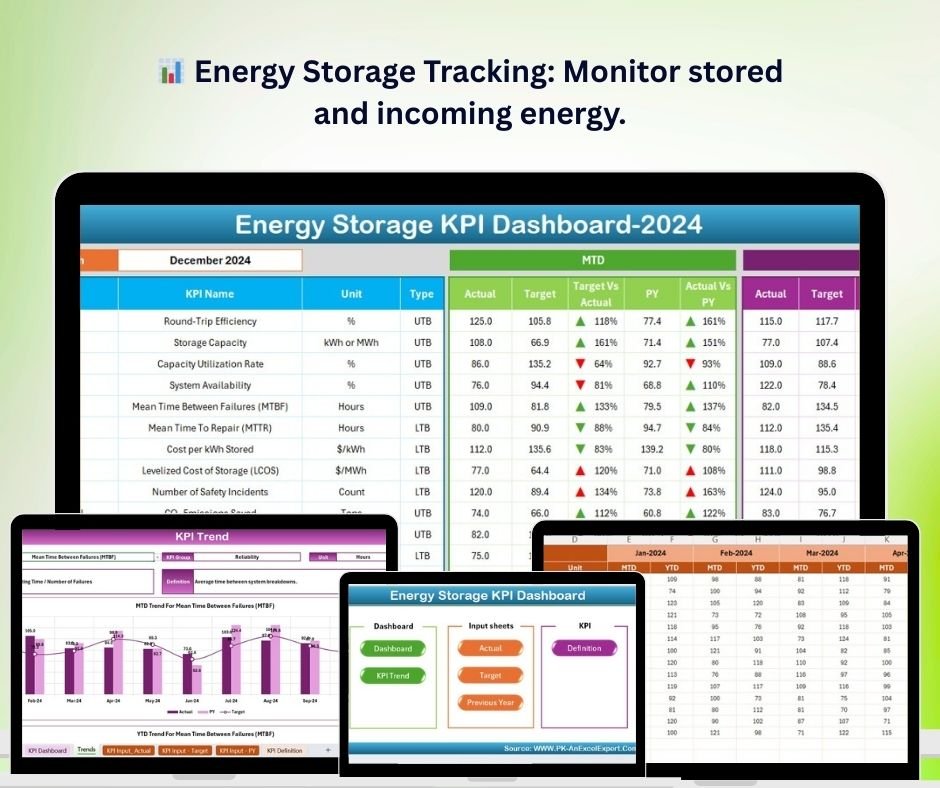
📊 Energy Storage Tracking
Monitor the total energy stored in your systems. Track the incoming energy from various sources, such as solar or grid power, and compare it with stored energy to understand capacity utilization.
🔋 Charge/Discharge Cycles Monitoring
Track the number of charge and discharge cycles for each energy storage unit. This helps monitor the lifecycle of your storage equipment and anticipate maintenance needs.
📉 Energy Efficiency Analysis
Analyze the efficiency of your energy storage system by tracking the energy input vs. output. This allows you to evaluate how well your system is storing and releasing energy.
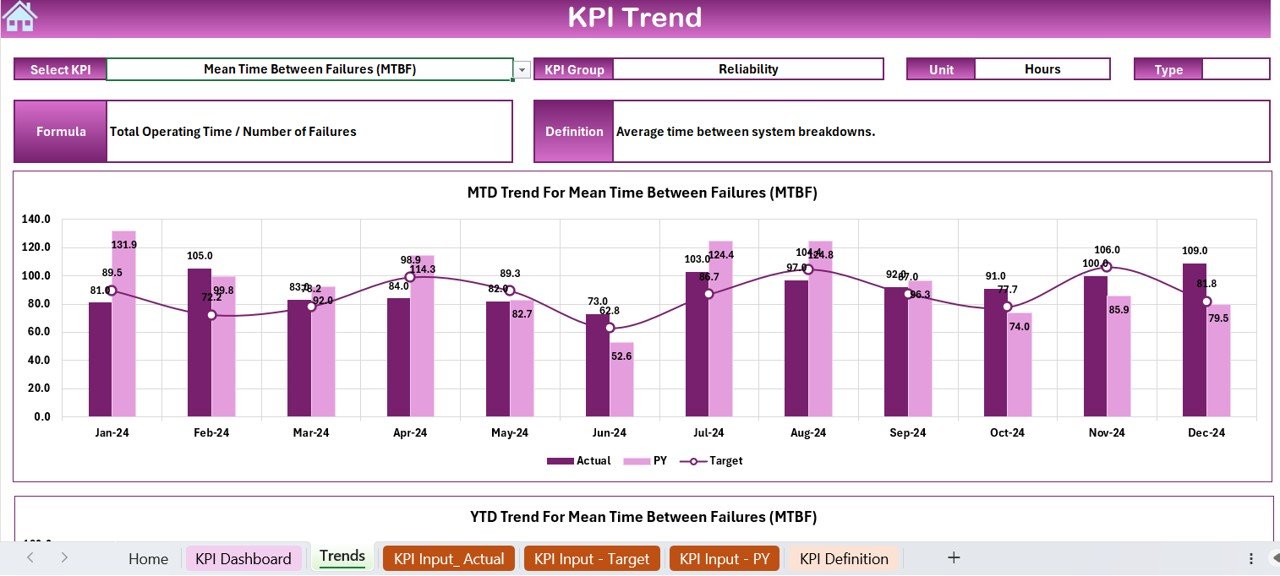
📅 Time-Based Performance Monitoring
Monitor key metrics over time (daily, weekly, monthly) to identify trends and make data-driven decisions to improve system performance.
⚙️ Real-Time Data Tracking
Integrate data from your energy storage systems to provide real-time insights into energy storage and usage. This ensures that you are always up to date with the most relevant performance data.
📈 Customizable Metrics & Reporting
Customize the dashboard to track the most relevant KPIs for your energy storage system. You can add or adjust metrics based on your unique requirements and generate detailed reports on energy efficiency and storage performance.
Why You’ll Love the Energy Storage KPI Dashboard in Excel
✅ Comprehensive Performance Monitoring
Track all key metrics of your energy storage systems, from total energy stored to charge/discharge cycles, ensuring optimal performance at all times.
✅ Maximize Efficiency
Identify inefficiencies in your system by analyzing energy input and output and take proactive steps to improve performance and reduce energy losses.
✅ Proactive Maintenance Planning
Monitor the number of charge/discharge cycles to anticipate when maintenance or replacement is needed, reducing downtime and increasing system longevity.
✅ Real-Time & Time-Based Analysis
Access real-time data and analyze performance over time to make quick adjustments and long-term strategic decisions.
✅ Customizable for Any Energy Storage System
The dashboard is flexible and can be customized to suit different types of energy storage systems, whether for solar, grid-connected, or other energy solutions.
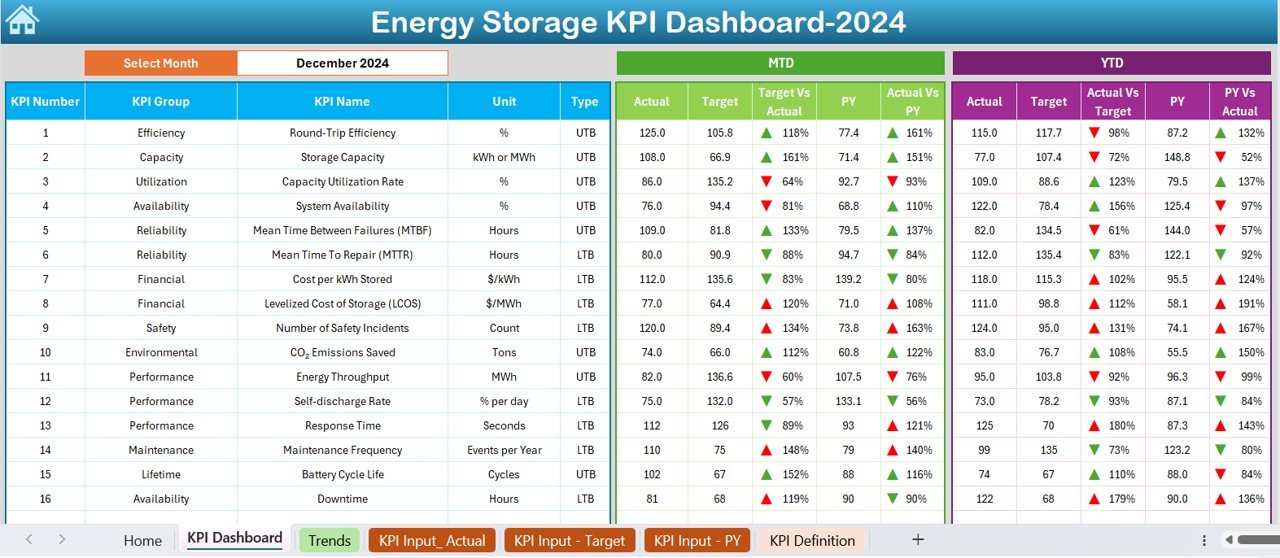
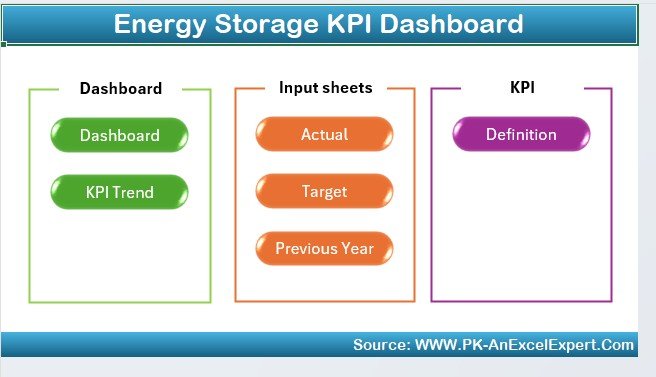
What’s Inside the Energy Storage KPI Dashboard in Excel?
-
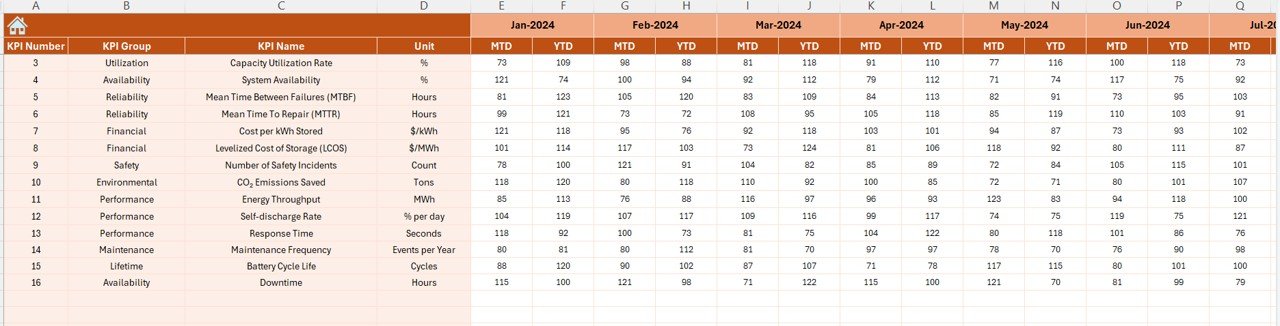
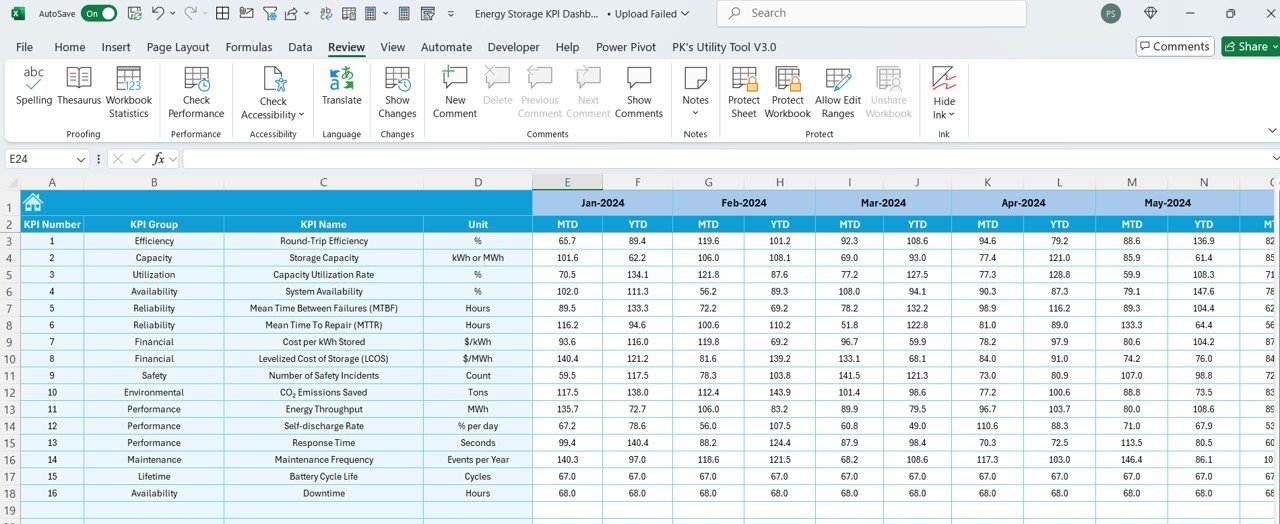
Energy Storage Tracking: Monitor energy input and stored energy data.
-
Charge/Discharge Cycles: Track the lifecycle of energy storage units.
-
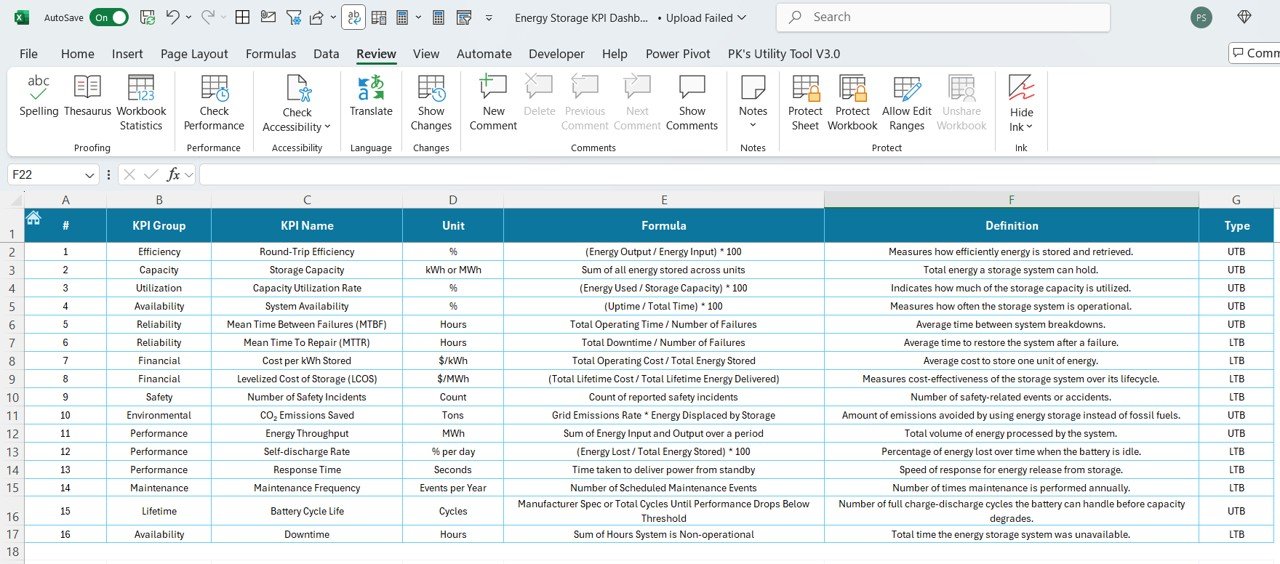
Energy Efficiency Metrics: Evaluate system efficiency by comparing input vs. output energy.
-
Time-Based Monitoring: Analyze data over various time periods to track trends.
-
Customizable Metrics: Add or adjust KPIs based on your specific energy storage system.
-
Real-Time Data Integration: Use real-time data to track and optimize performance.
How to Use the Energy Storage KPI Dashboard in Excel
1️⃣ Download the Template: Get the Energy Storage KPI Dashboard in Excel instantly.
2️⃣ Integrate Your Data: Connect your energy storage system data for real-time insights.
3️⃣ Monitor Key Metrics: Track energy storage, charge/discharge cycles, and energy efficiency.
4️⃣ Analyze Performance Trends: Use time-based analysis to identify trends and make adjustments.
5️⃣ Generate Reports & Improve Efficiency: Generate reports to evaluate system performance and make data-driven improvements.
Who Can Benefit from the Energy Storage KPI Dashboard in Excel?
🔹 Energy Storage Providers & Companies
🔹 Solar Energy Companies
🔹 Electric Grid Operators
🔹 Renewable Energy Companies
🔹 Data Scientists & Energy Analysts
🔹 Business Owners & Operations Managers in Energy Storage
🔹 Small & Medium Enterprises (SMBs) in the Energy Sector
Ensure optimal performance of your energy storage system with the Energy Storage KPI Dashboard in Excel. Track energy efficiency, monitor charge cycles, and improve system reliability—all in one easy-to-use dashboard.
Click here to read the Detailed blog post
Visit our YouTube channel to learn step-by-step video tutorials
Youtube.com/@PKAnExcelExpert


Reviews
There are no reviews yet.