
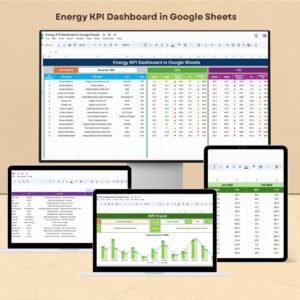
The Energy KPI Dashboard in Google Sheets is a comprehensive tool designed to help organizations monitor and optimize their energy consumption effectively. This customizable dashboard allows businesses to track key performance indicators (KPIs) related to energy usage, efficiency, and cost, enabling data-driven decisions that promote sustainability and cost savings.
By leveraging Google Sheets’ collaborative features, this dashboard facilitates real-time updates and easy sharing among team members, ensuring that all stakeholders have access to the most current energy data. Whether you’re aiming to reduce energy costs, improve efficiency, or meet sustainability goals, this dashboard provides the insights needed to drive meaningful change.
Key Features of the Energy KPI Dashboard in Google Sheets
📊 Comprehensive Dashboard Overview
-
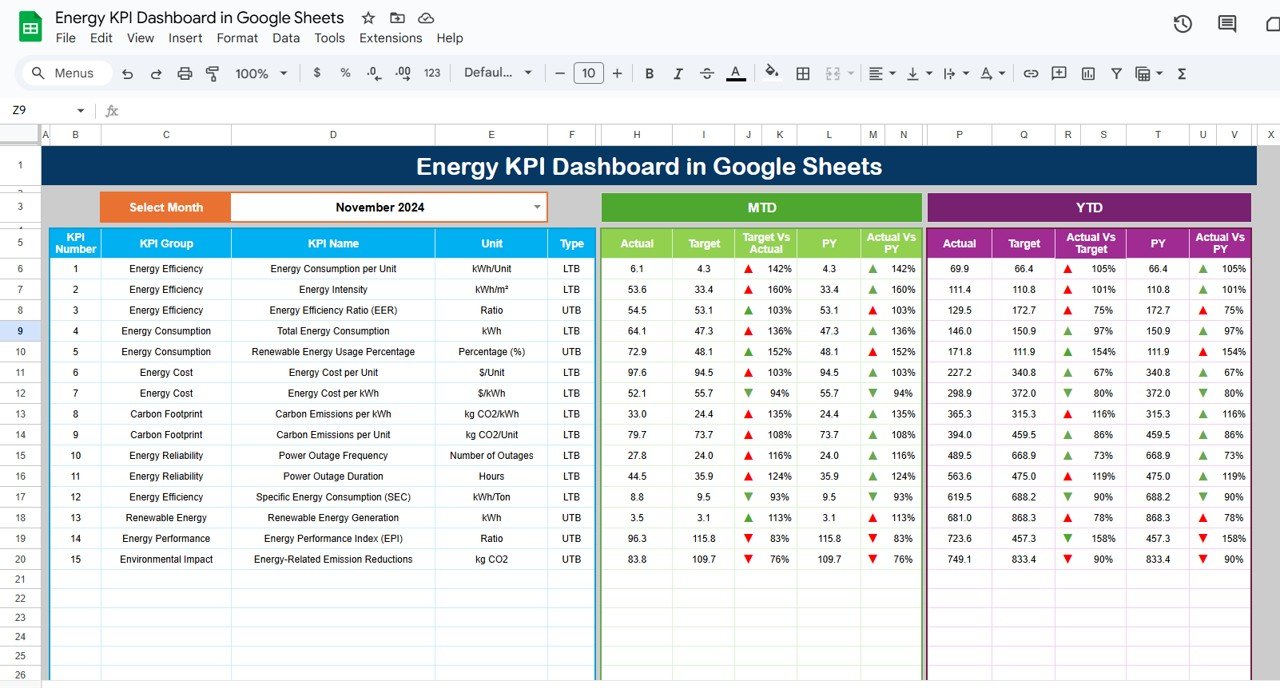
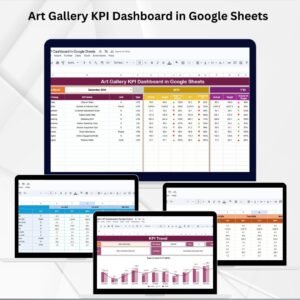
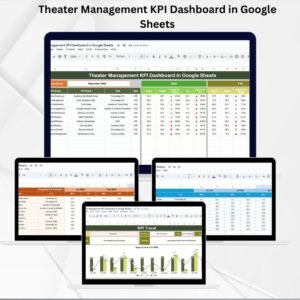
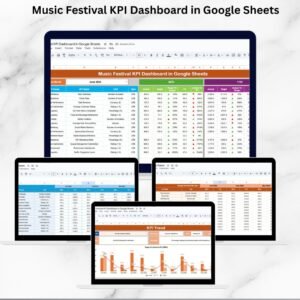
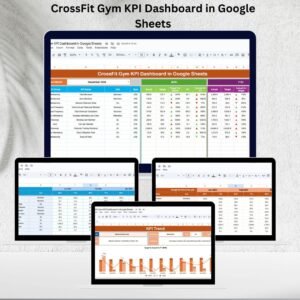
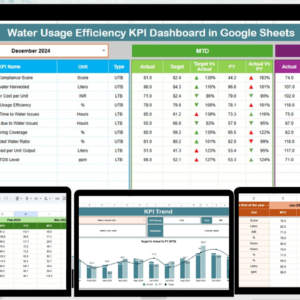
Performance Metrics Display: The dashboard provides a visual representation of essential energy KPIs, such as energy consumption, efficiency ratios, and cost per unit.
-
Dynamic Data Selection: Users can select specific months from a dropdown menu, allowing the dashboard to update KPI data accordingly for detailed analysis.
📈 Detailed KPI Analysis
-
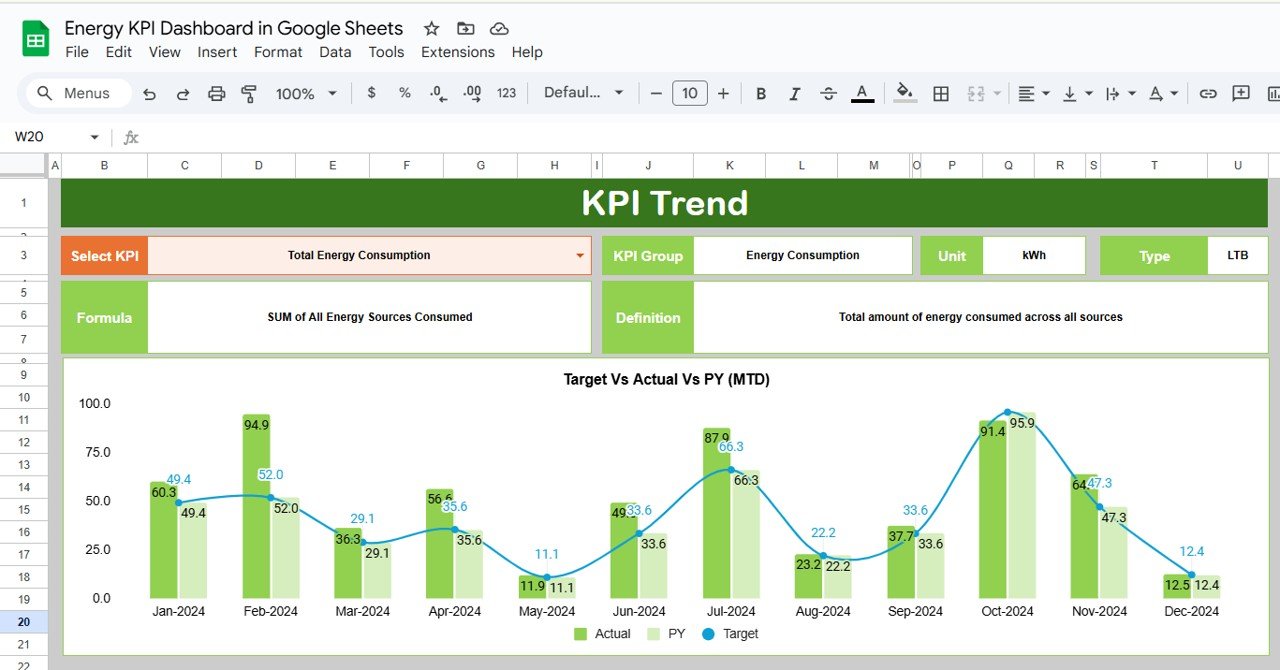
KPI Trend Tracking: Monitor the performance of individual energy KPIs over time with trend charts that compare actual figures against targets and previous year data.
-
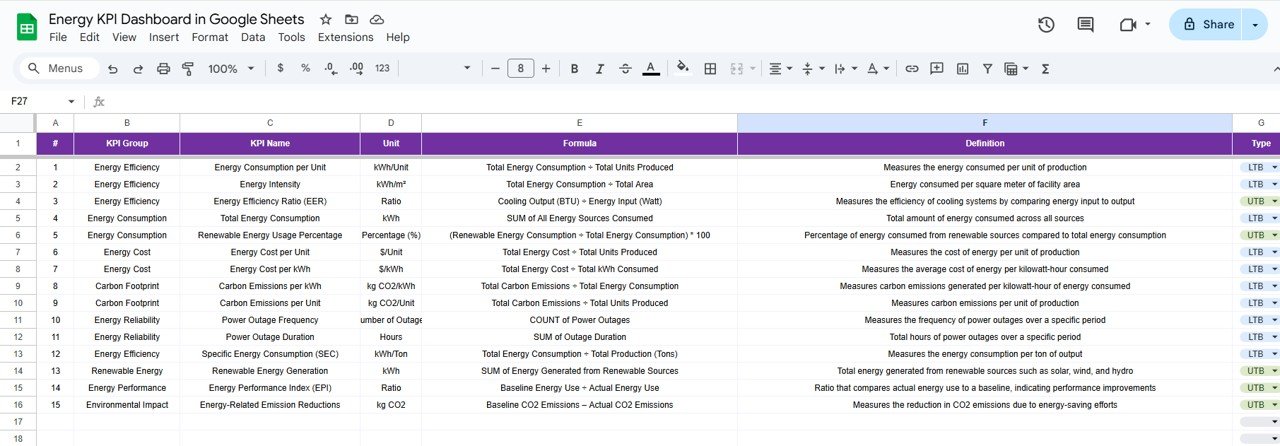
KPI Definitions and Formulas: Access comprehensive details about each KPI, including definitions, units of measurement, and calculation formulas, ensuring clarity and consistency in performance assessment.
🛠 Data Management and Customization
-
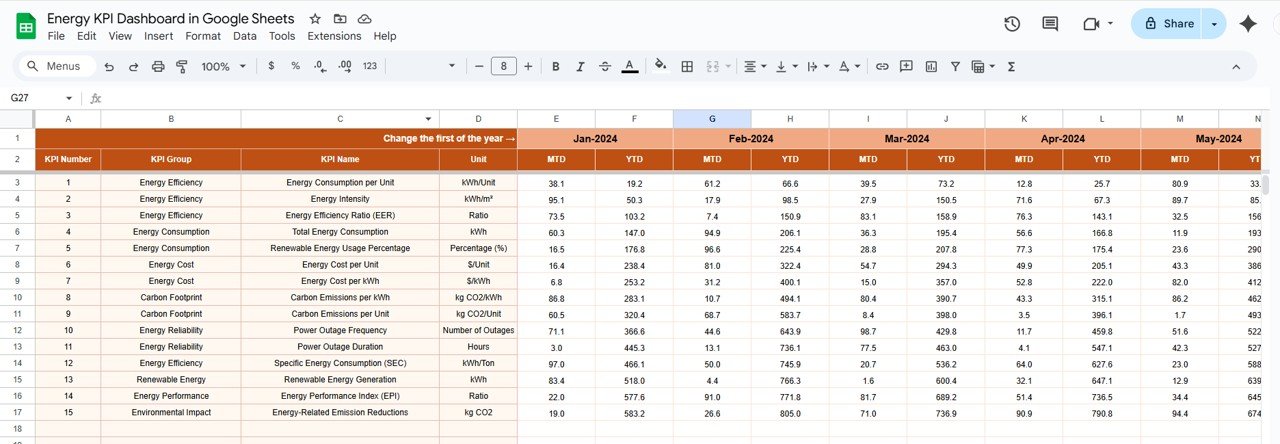
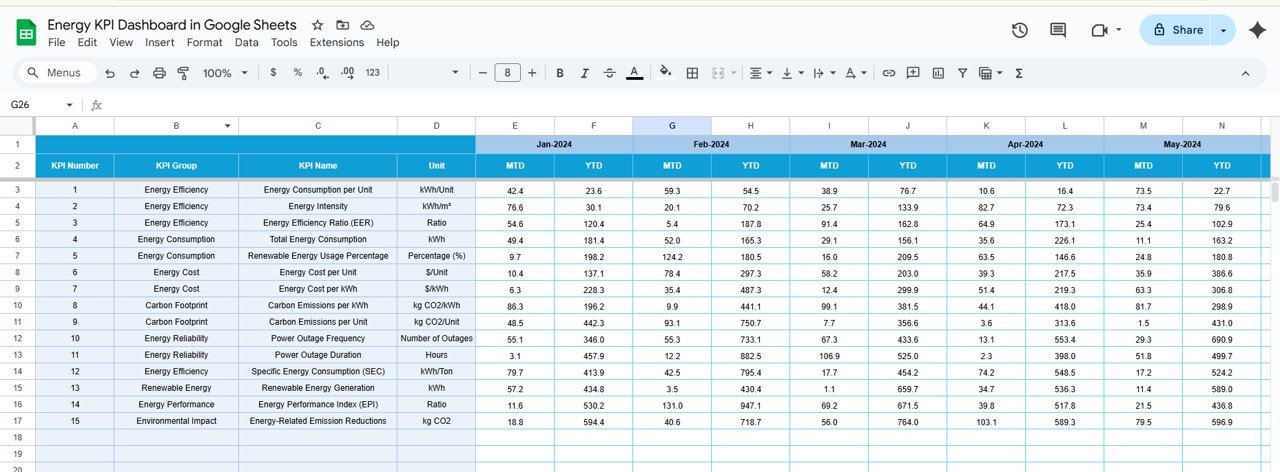
Actual Numbers Input: Easily input and update monthly and yearly actual performance data, ensuring that the dashboard reflects the most current figures.
-
Target Setting: Define monthly and yearly targets for each KPI, facilitating performance comparisons and goal tracking.
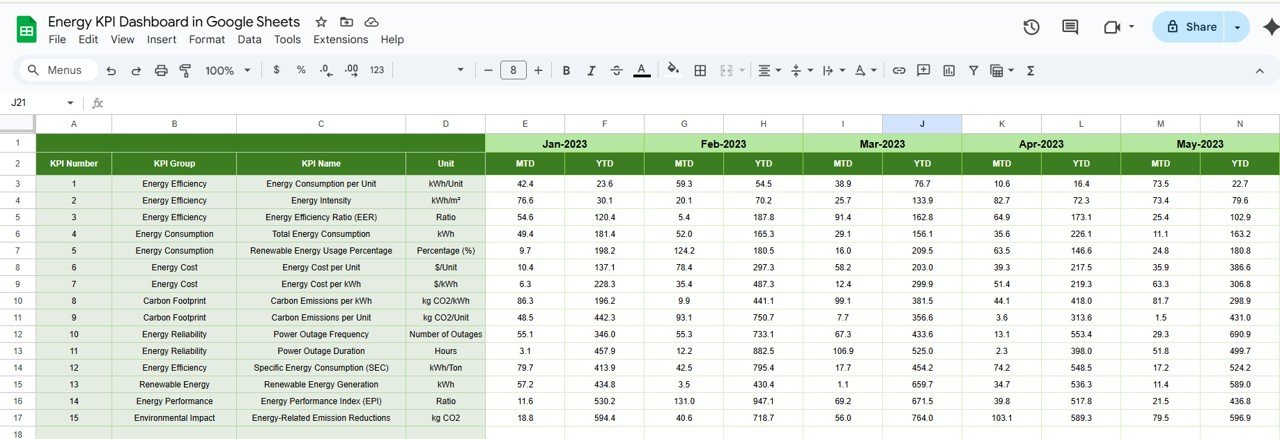
-
Historical Data Comparison: Maintain and compare performance data against previous years to identify trends and areas needing improvement.
🧭 User-Friendly Navigation and Support
-
Home Sheet Navigation: A central hub with interactive buttons allows quick access to various sections of the dashboard.
-
Support and Customization: Access guidelines and instructions for setting up and customizing the dashboard to align with specific organizational needs.
Benefits of Using the Energy KPI Dashboard in Google Sheets
✅ Enhanced Decision-Making
By consolidating critical energy data, the dashboard supports informed decisions that drive energy efficiency and cost savings.
✅ Improved Operational Efficiency
Identifying trends and areas needing attention allows for targeted improvements in energy management practices.
✅ Customization and Flexibility
The dashboard can be tailored to track specific energy KPIs relevant to your organization, adapting to evolving sustainability objectives.
Getting Started with Your Energy KPI Dashboard in Google Sheets
-
Define Energy KPIs: Identify the key energy indicators that align with your organization’s sustainability goals, such as energy consumption, efficiency ratios, and cost per unit.
-
Develop the Dashboard Layout: Utilize the provided template or design a customized dashboard that includes sections for data entry, KPI tracking, and visualizations.
-
Input Data: Enter historical and target data for each KPI, ensuring accuracy and consistency in data entry.
-
Customize Features: Adjust the dashboard to reflect your organization’s specific energy objectives, including modifying KPIs, setting targets, and personalizing visual elements.
-
Monitor and Update: Regularly review and update the dashboard to ensure it reflects the most current data and aligns with evolving energy strategies.
By implementing the Energy KPI Dashboard in Google Sheets, your organization can streamline energy performance monitoring, promote sustainability, and make data-driven decisions to enhance overall energy efficiency.
Click here to read the Detailed blog post
Energy KPI Dashboard in Google Sheets
Visit our YouTube channel to learn step-by-step video tutorials
YouTube.com/@PKAnExcelExpert


Reviews
There are no reviews yet.