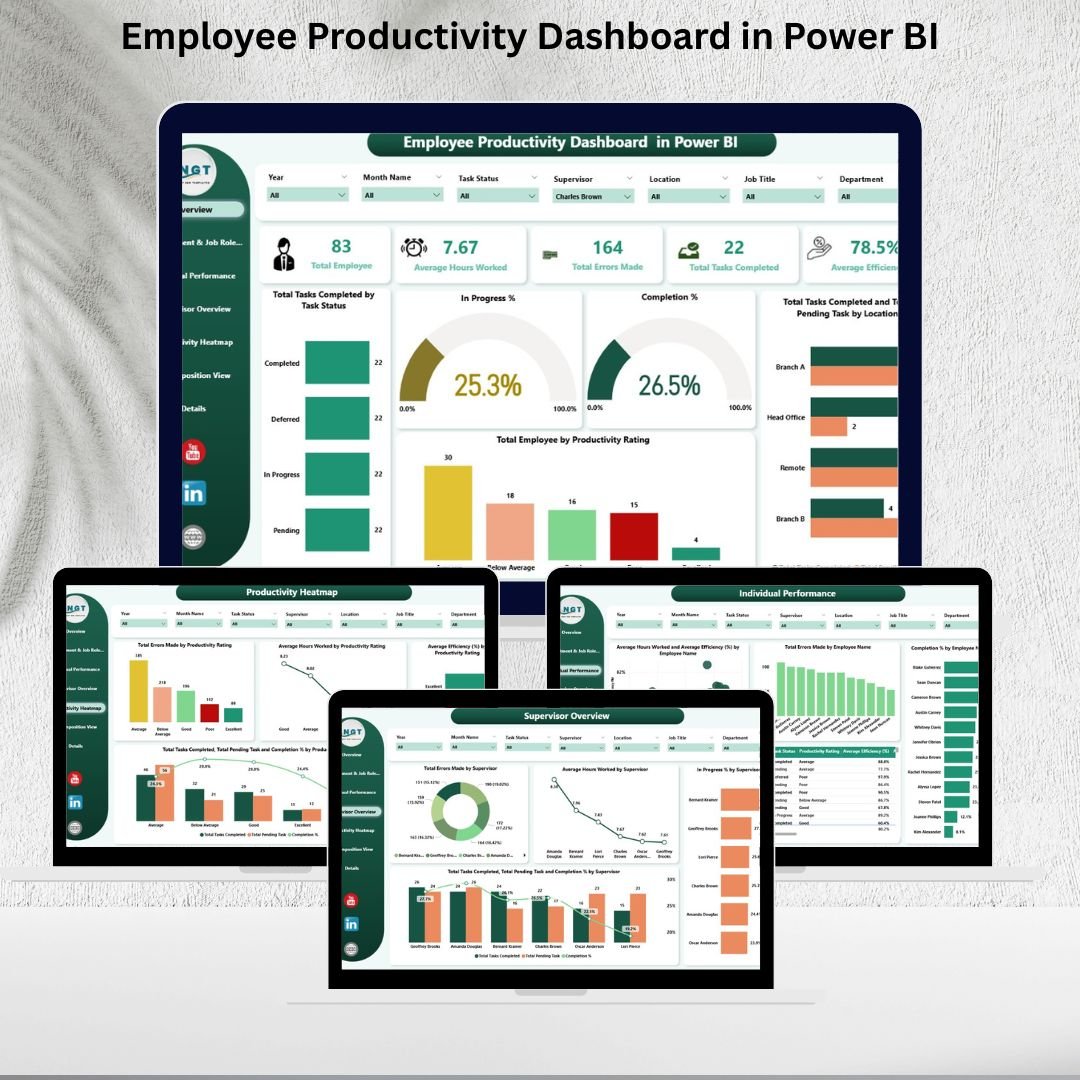
Employee productivity is the heartbeat of any organization. Tracking hours worked, completed tasks, efficiency, and errors is critical for ensuring optimal performance, but managing this manually can be overwhelming. That’s where the Employee Productivity Dashboard in Power BI comes in.
This ready-to-use Power BI template transforms complex data into clear, interactive visualizations, allowing managers, supervisors, and HR teams to monitor workforce performance, uncover bottlenecks, and make data-driven decisions that boost productivity. 📊✅
🔑 Key Features of the Employee Productivity Dashboard
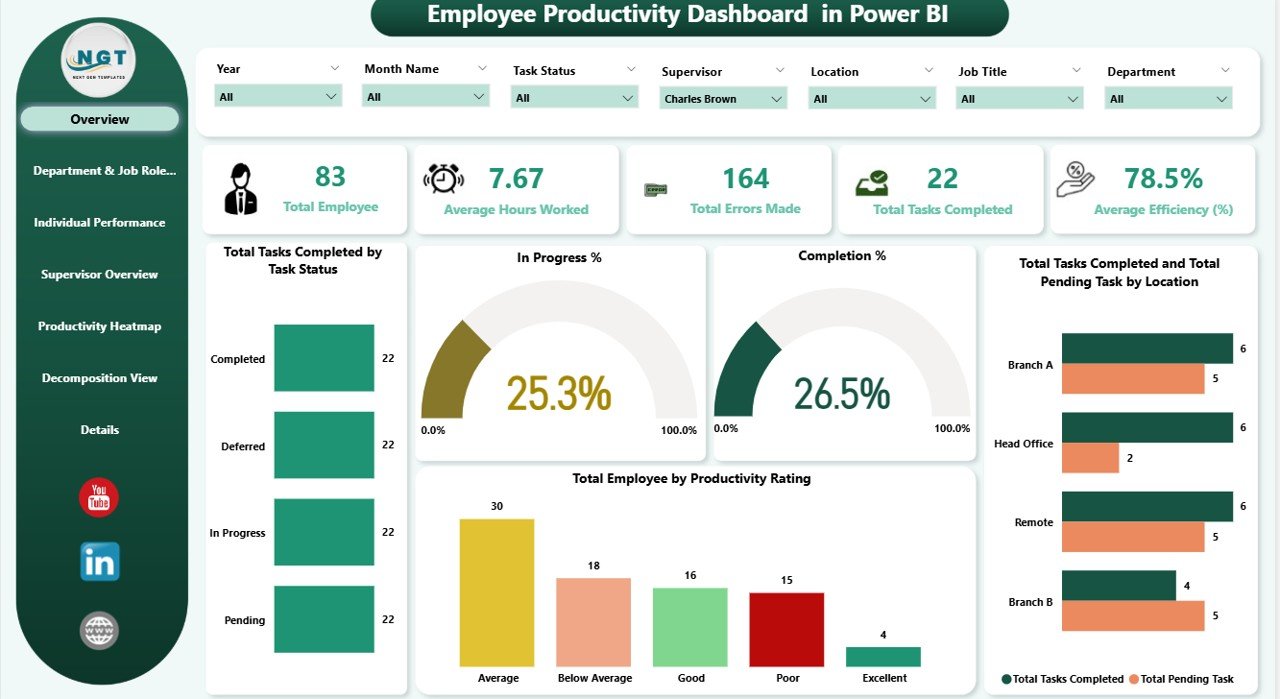
📋 Overview Page
-
Instant snapshot of performance with key cards:
-
Total Employees
-
Average Hours Worked
-
Total Errors Made
-
Total Tasks Completed
-
Average Efficiency (%)
-
-
Visual charts to analyze task status, completion %, employee productivity ratings, and task distribution by location.
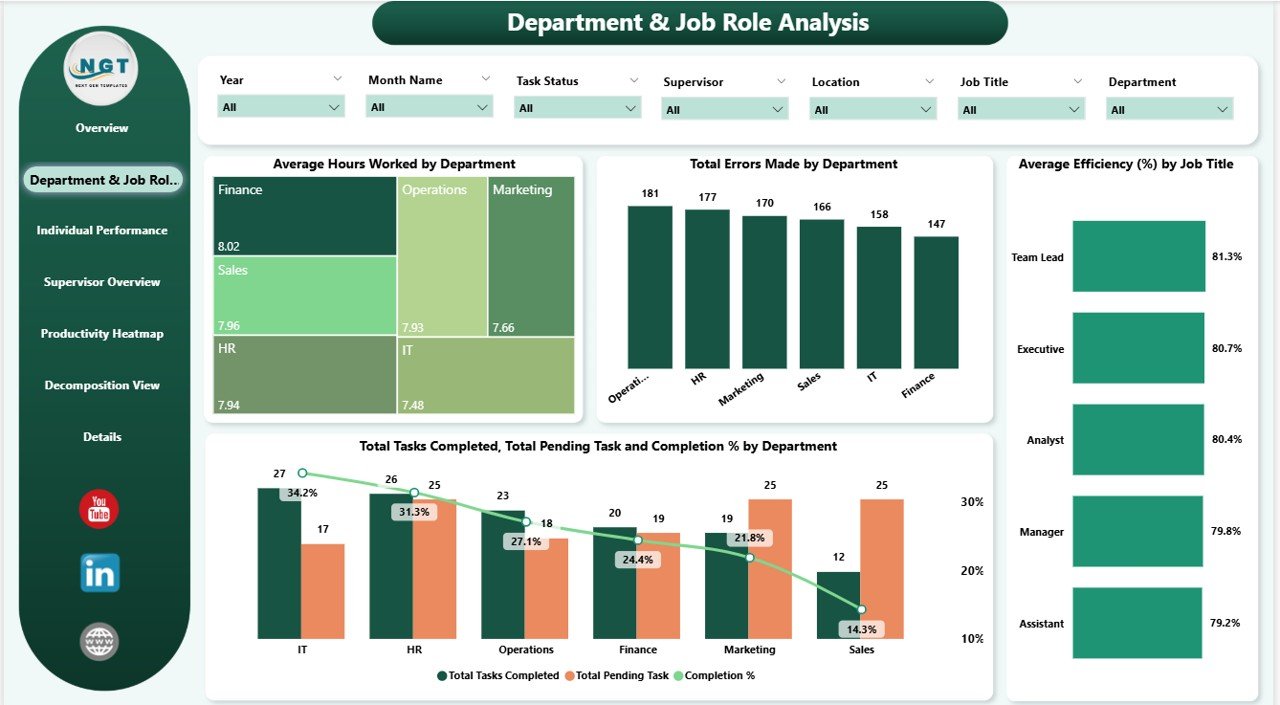
🏢 Department & Job Role Analysis
-
Evaluate productivity at the team and role level.
-
Track average hours, completion %, and errors across departments.
-
Compare job roles to identify high-performing groups or underutilized roles.
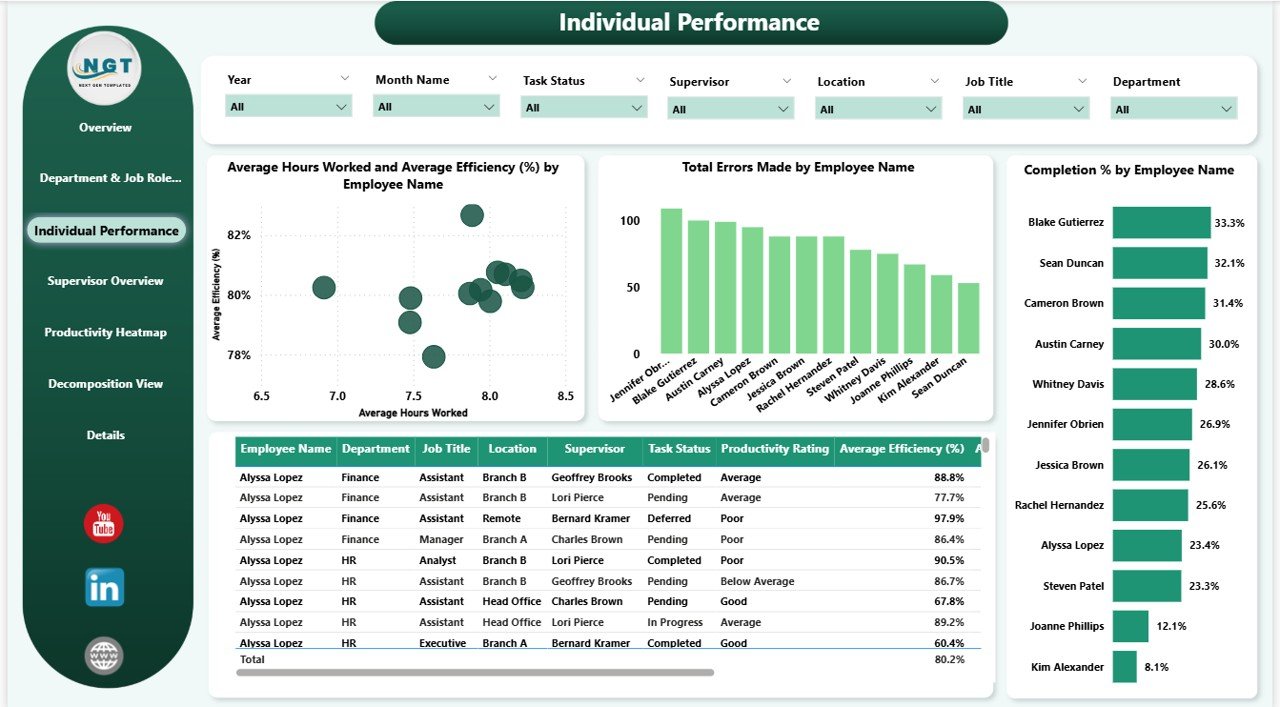
👤 Individual Performance
-
Drill into employee-level performance.
-
Track hours worked, errors made, efficiency, and completion % by name.
-
Identify top performers and employees needing support.
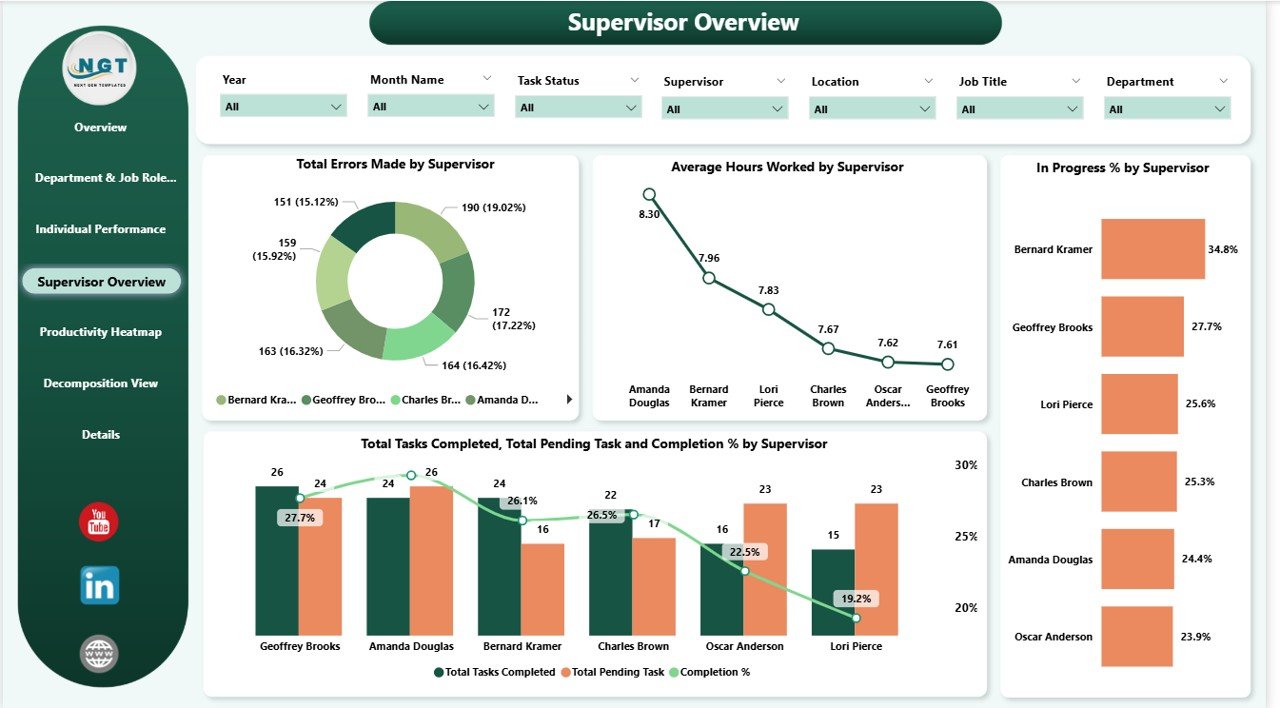
👨💼 Supervisor Overview
-
Assess how supervisors influence performance.
-
Charts include total errors by supervisor, hours worked, and task completion.
-
Evaluate managerial effectiveness and team oversight.
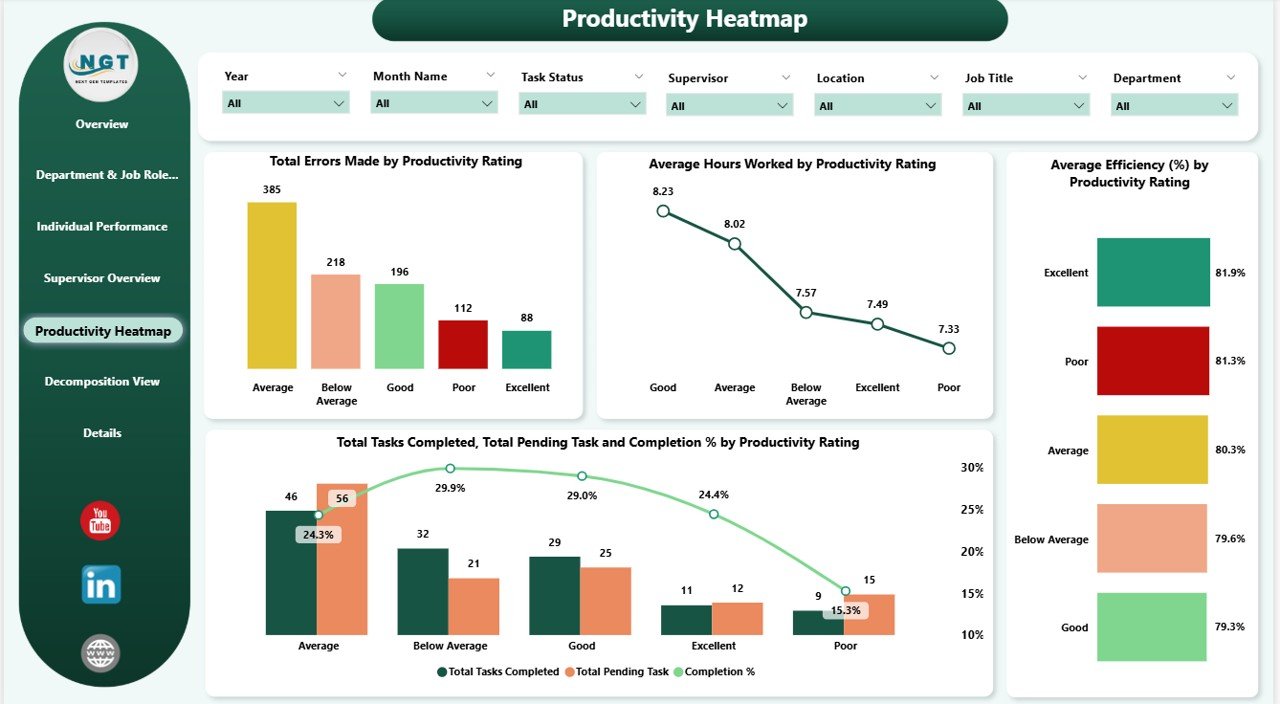
🔥 Productivity Heatmap
-
Visualize trends based on productivity ratings.
-
Charts include errors, hours worked, efficiency, and task completion by rating.
-
Spot strengths and weaknesses across employee groups.
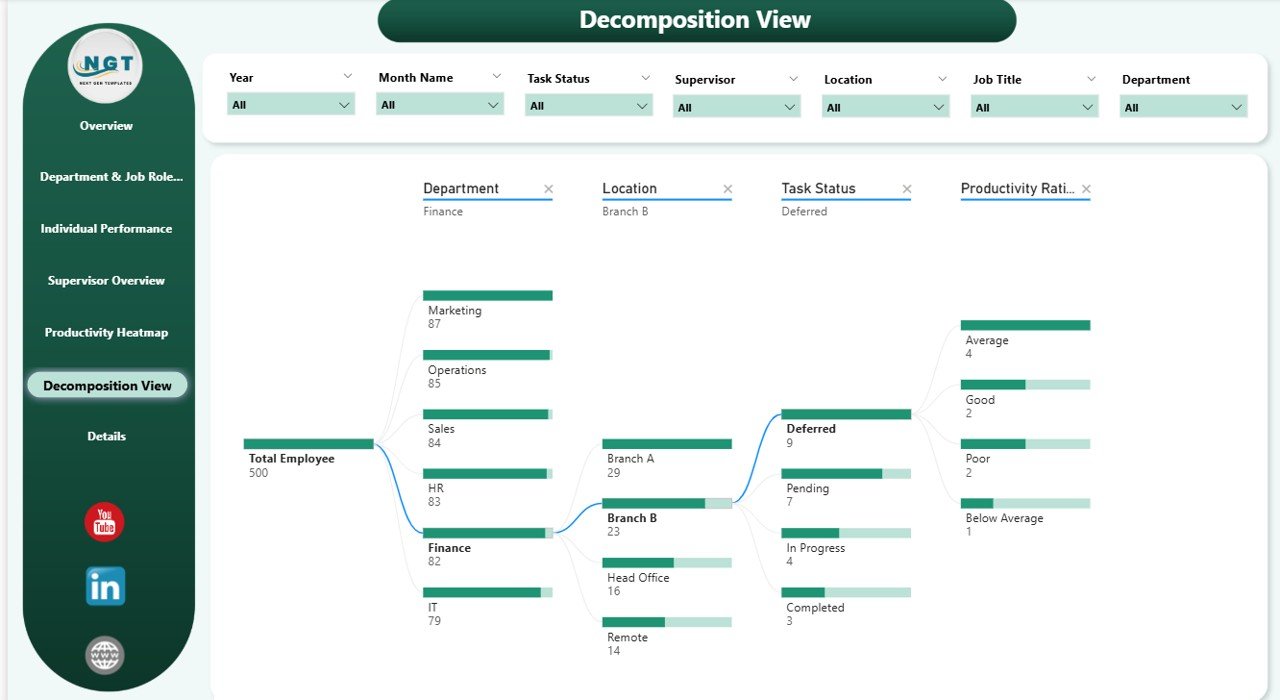
🌳 Decomposition View
-
Analyze metrics hierarchically with a decomposition tree.
-
Break down productivity by department, employee, or task type.
-
Pinpoint root causes of inefficiencies.
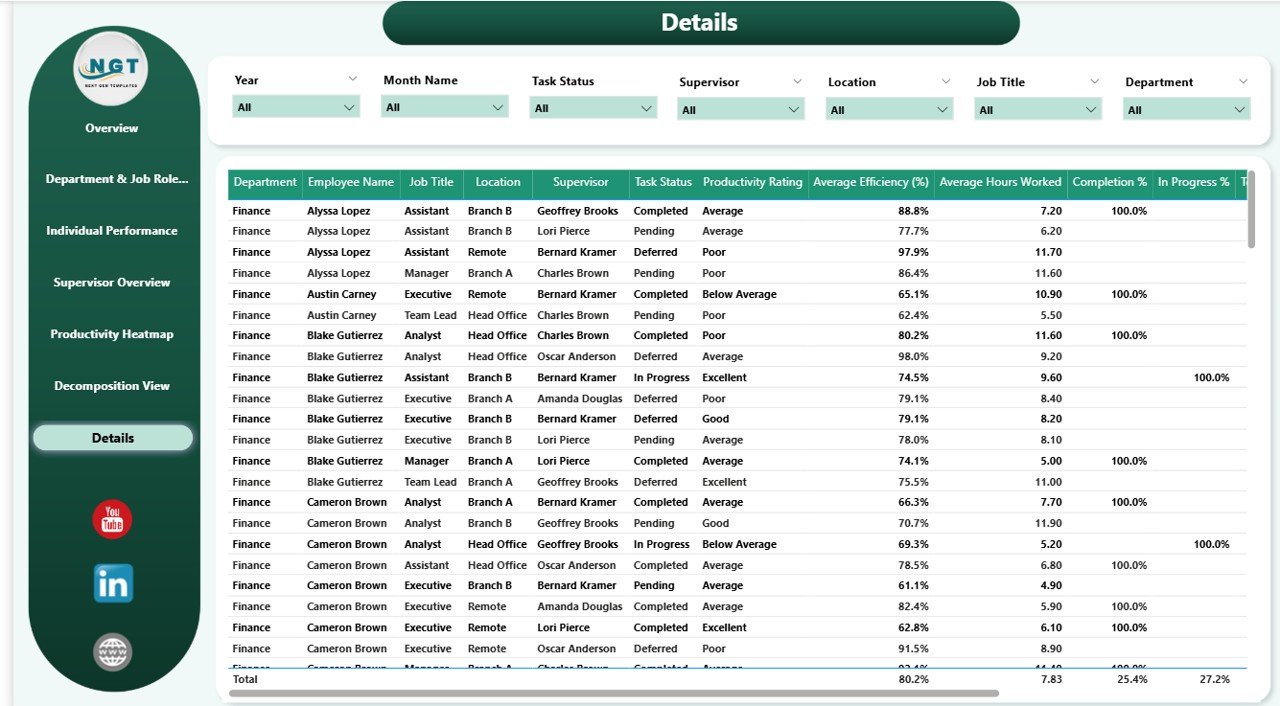
📑 Details Page
-
Access raw tabular data for in-depth analysis.
-
Drill through individual records to uncover deeper insights.
📦 What’s Inside the Employee Productivity Dashboard?
When you download this product, you’ll get:
✅ Power BI File (.pbix) – Pre-built, fully interactive dashboard
✅ Overview Page – High-level workforce insights
✅ Department & Job Role Analysis Page – Evaluate team performance
✅ Individual Performance Page – Employee-specific details
✅ Supervisor Overview Page – Assess leadership effectiveness
✅ Productivity Heatmap Page – Spot workforce trends
✅ Decomposition View Page – Break down metrics hierarchically
✅ Details Page – Complete tabular data view
This dashboard is 100% customizable. Add your own KPIs, adjust visuals, and tailor it to your organization’s reporting needs.
🧑💼 Who Can Benefit from This Dashboard?
🎯 HR Teams – Monitor employee efficiency and identify training needs
🎯 Department Heads – Track team performance and resource allocation
🎯 Supervisors – Gain insights into task completion and error management
🎯 Executives – View high-level workforce trends to support strategic decisions
🎯 Project Managers – Ensure tasks are completed on time and within quality standards
This tool is designed for organizations of all sizes that want clarity and control over workforce productivity.
🧪 How to Use the Employee Productivity Dashboard
-
Load Your Data – Connect your task, time, and employee data into Power BI.
-
Explore the Overview Page – View KPIs like hours worked, efficiency, and task completion.
-
Drill into Analysis Pages – Explore department, job role, individual, or supervisor performance.
-
Monitor Trends – Use the heatmap and decomposition tree for deeper insights.
-
Take Action – Use the data to optimize workflows, reduce errors, and reward top performers.
With its intuitive design and built-in drill-down features, this dashboard turns complex data into simple, actionable insights.
🌟 Why Choose This Dashboard?
-
Centralized productivity tracking
-
Interactive visualizations & heatmaps
-
Employee, supervisor, and department-level insights
-
Error and efficiency monitoring
-
Fully customizable for your KPIs
-
Built for actionable decision-making
With the Employee Productivity Dashboard in Power BI, you’ll always know where your teams stand — and how to help them improve. 🌟
🔗 Click here to read the Detailed blog post
Watch the step-by-step video Demo:


Reviews
There are no reviews yet.