📊 Employee Performance Tracking Dashboard in Excel
Employee performance is one of the most important drivers of organizational success. Companies that track, measure, and analyze employee contributions can identify strengths, uncover weaknesses, and design strategies that lead to higher productivity and growth. Without proper monitoring, businesses risk missed opportunities, disengagement, and uneven workloads.
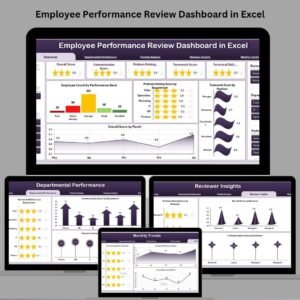
The Employee Performance Tracking Dashboard in Excel solves these challenges by giving managers, HR teams, and business leaders a centralized, interactive, and easy-to-use reporting system. With its combination of cards, charts, slicers, and detailed data sheets, this dashboard makes it possible to track performance at multiple levels — department, job role, rating, and monthly trends — all in one file.
Whether you are a small business owner, HR manager, or corporate leader, this dashboard offers the insights needed to recognize top talent, detect performance gaps, and plan future workforce strategies.
✨ Key Features
🔹 Page Navigator
-
A left-hand panel that allows smooth switching across different analysis pages.
-
No endless scrolling — just one click to move from Overview to Department, Job Role, Rating, or Monthly Trends.
🔹 KPI Cards
-
High-level performance insights at a glance.
-
Examples: Performance Score by Department, Promotion Not Eligible %, Good + Excellent Performance %.
🔹 Interactive Charts
-
Department-wise, Job Role-wise, and Month-wise visualizations.
-
Track projects completed, training hours, ratings, and promotion eligibility.
🔹 Right-Side Slicers
-
Dynamic filters to refine results by department, role, or evaluation period.
🔹 Data & Support Sheets
-
Data Sheet: Stores all employee-level records (scores, training, projects, ratings).
-
Support Sheet: Contains dropdowns and reference lists to keep data consistent.
📑 Page-by-Page Breakdown
🏠 Overview Page
-
KPI Cards: Performance Score by Department, Promotion Not Eligible %, Good + Excellent Performance %, Projects Completed by Month.
-
Provides a big-picture summary for leadership.
🏢 Department Analysis
-
Charts: Good + Excellent Performance % by Department, Projects Completed by Department, Training Hours by Department.
-
Helps HR identify high- and low-performing departments.
👔 Job Role Analysis
-
Charts: Good + Excellent Performance % by Job Role, Projects Completed by Job Role, Training Hours by Job Role.
-
Pinpoints which job roles contribute most to organizational growth.
⭐ Rating Analysis
-
Charts: Performance Score by Job Role, Performance Score by Total Employees, Projects Completed by Top 7 Employee Names.
-
Ideal for recognizing top performers and evaluating employee ratings.
📅 Monthly Trends
-
Charts: Not Eligible Count by Month, Avg. + Below Avg. Performance by Month, Performance Score by Month.
-
Detects seasonal changes and long-term performance shifts.
🏆 Advantages of Using the Dashboard
-
📊 Centralized Insights – All data in one place, no scattered spreadsheets.
-
⚡ Quick Decisions – Real-time performance views for managers.
-
🏅 Employee Recognition – Spot top talent for promotions and rewards.
-
📉 Gap Detection – Identify skill gaps and training needs.
-
📆 Trend Analysis – Monthly tracking for long-term planning.
-
💰 Cost-Effective – No need for expensive HR software.
-
🛠 Customizable – Adapt KPIs, charts, and layouts to your business.
💡 Opportunities for Improvement
-
🔄 Automation with VBA – Reduce manual updates.
-
🔗 Data Integration – Connect with HRMS or payroll systems.
-
📈 Advanced Visualization – Export to Power BI for deeper analytics.
-
🔔 Alerts/Notifications – Trigger reminders for deadlines or underperformance.
-
🤖 Predictive Analytics – Use trends to forecast future performance.
📌 Best Practices
-
📝 Update Data Regularly – Weekly or monthly updates for accuracy.
-
🎯 Use Consistent Metrics – Define clear KPIs across departments.
-
👥 Promote Transparency – Share dashboards with managers & leaders.
-
🎓 Link Training with Performance – Design training based on gaps.
-
📊 Review Monthly Trends – Spot early warning signs.
-
🔐 Protect Sensitive Data – Password-protect employee records.
🎯 Conclusion
The Employee Performance Tracking Dashboard in Excel is more than just a template — it’s a strategic workforce management tool. With its structured pages, interactive visuals, and centralized records, it helps organizations recognize talent, improve accountability, and plan smarter workforce strategies.
For businesses of all sizes, this dashboard provides a simple, cost-effective, and powerful way to track employee performance and ensure sustainable growth.
❓ FAQs
Q1. Who can use this dashboard?
HR managers, department heads, business leaders, and small business owners.
Q2. Can I customize it?
Yes, you can modify KPIs, charts, and layouts to suit your needs.
Q3. Does it require advanced Excel skills?
No. It is user-friendly with pre-built charts and slicers.
Q4. How often should I update it?
Weekly or monthly updates are recommended for accuracy.
Q5. Can I integrate it with other tools?
Yes. It can be linked with HR systems or exported to Power BI.
Visit our YouTube channel to learn step-by-step video tutorials
🔗 Click here to read the Detailed blog post


Reviews
There are no reviews yet.