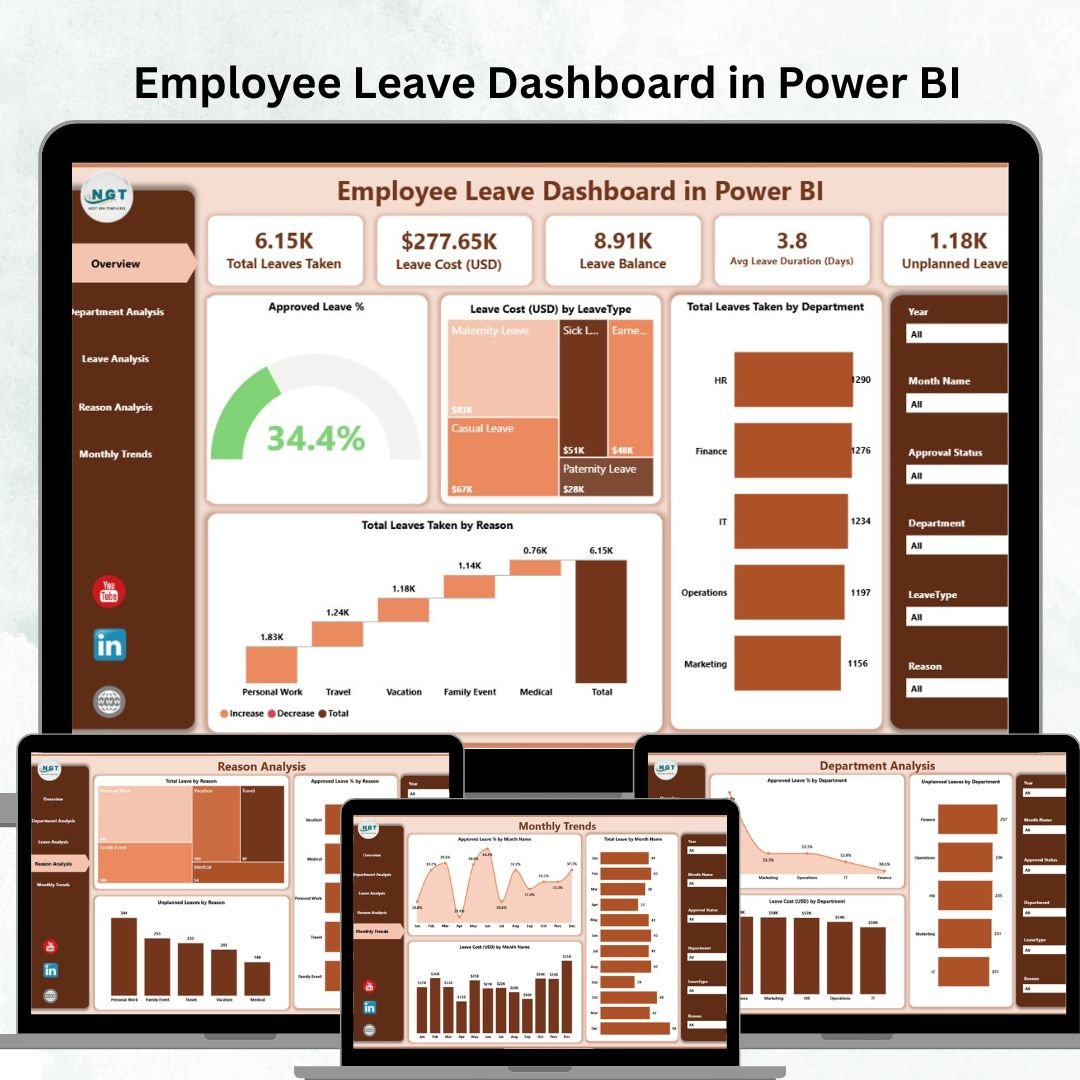
Managing employee leave effectively is one of the toughest challenges for HR professionals and business leaders. Without proper visibility into leave patterns, organizations risk productivity drops, increased costs, and workforce disruptions. That’s where the Employee Leave Dashboard in Power BI steps in.
This ready-to-use Power BI solution centralizes all leave data into one interactive, easy-to-read platform. Instead of wasting hours compiling reports in spreadsheets, HR teams can instantly monitor leave trends, track costs, and analyze absence reasons—helping leaders make data-driven decisions faster.
Whether you’re an HR manager, a finance executive, or a business leader, this dashboard gives you the insights you need to improve attendance, productivity, and workforce planning.
✨ Key Features of the Employee Leave Dashboard in Power BI
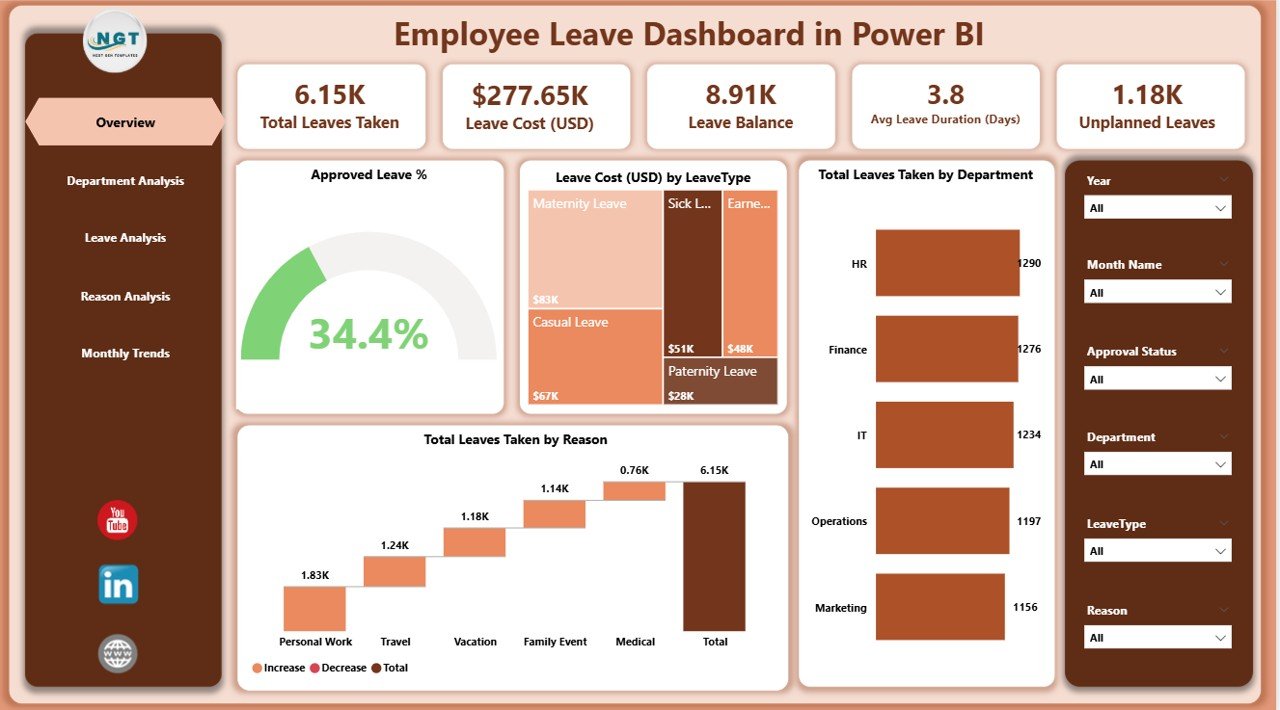
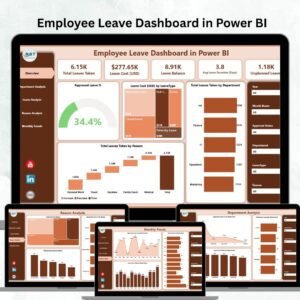
✅ Overview Page – A snapshot of leave performance with:
-
KPI cards (Approved Leave %, Total Leaves, Leave Cost USD).
-
Charts for Approved Leave %, Department-wise Leave, and Leave Reasons.
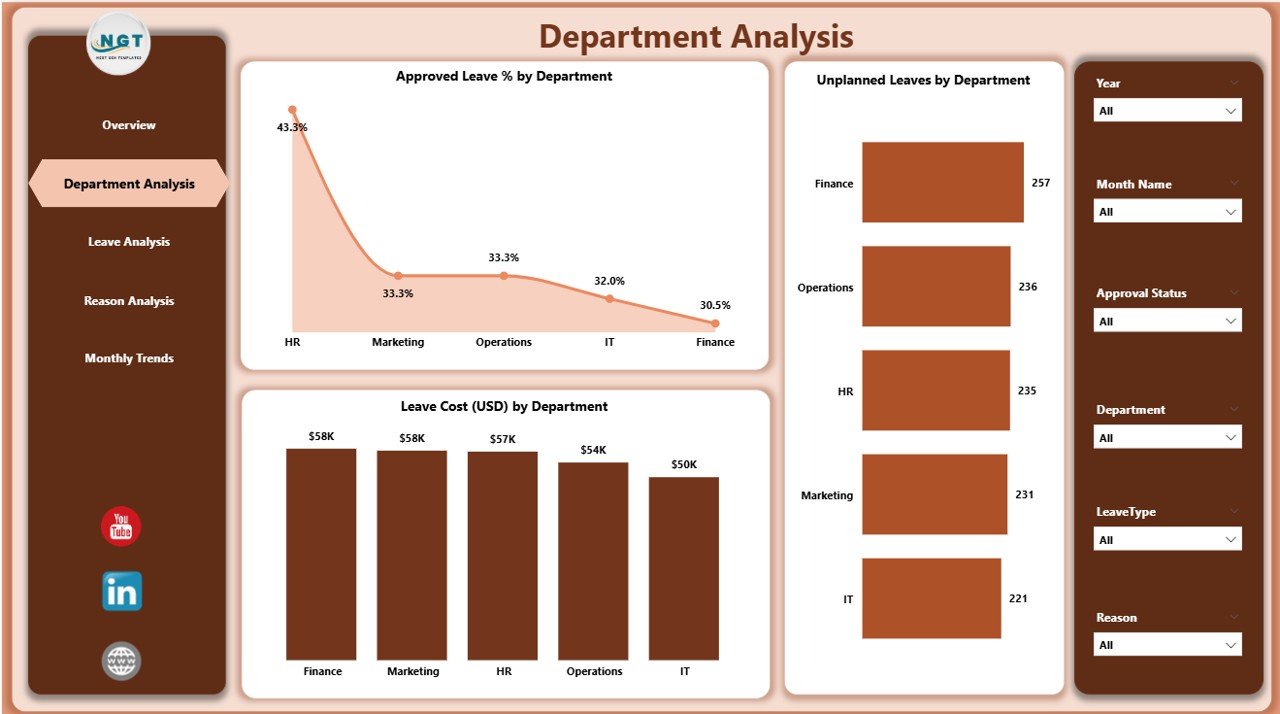
✅ Department Analysis Page – Drill down into departments with:
-
Approved Leave % by Department.
-
Unplanned Leaves by Department.
-
Leave Cost (USD) by Department.
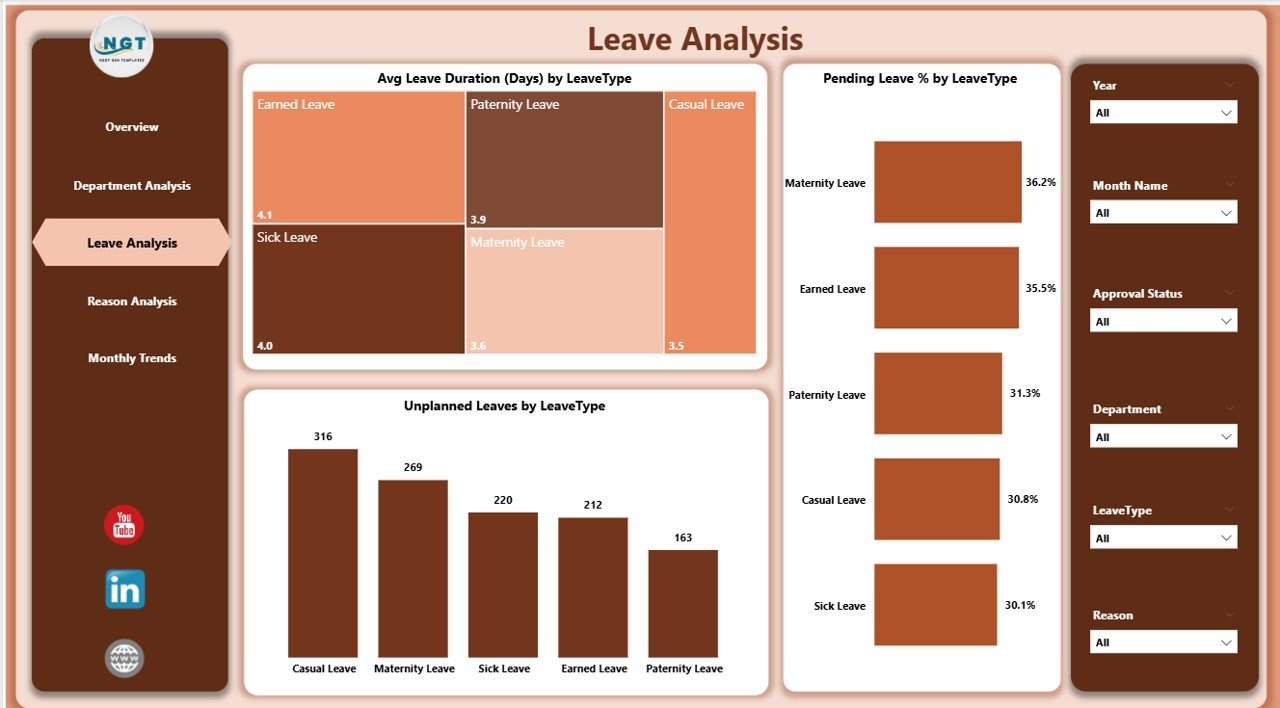
✅ Leave Analysis Page – Focus on leave types with:
-
Average Leave Duration by Type.
-
Pending Leave % by Type.
-
Unplanned Leaves by Type.
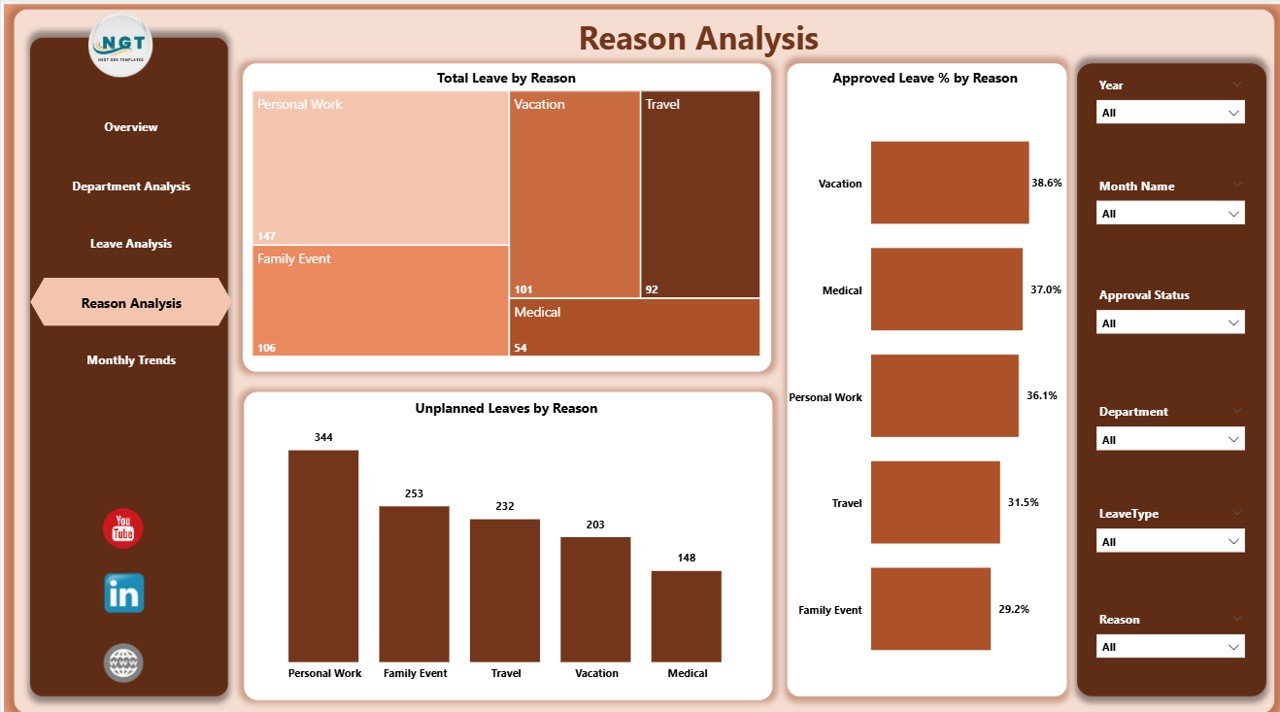
✅ Reason Analysis Page – Discover “why” employees take leave:
-
Total Leaves by Reason.
-
Approved Leave % by Reason.
-
Unplanned Leaves by Reason.
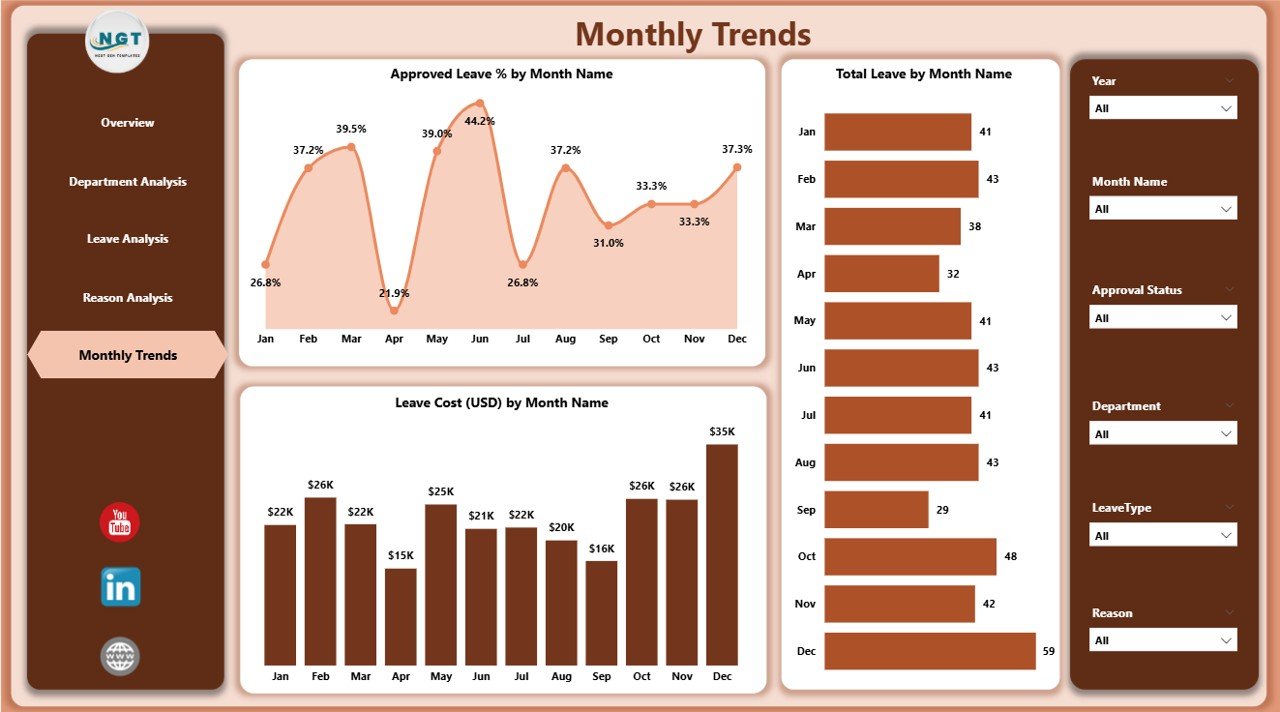
✅ Monthly Trends Page – Spot seasonal trends and patterns:
-
Approved Leave % by Month.
-
Total Leave Taken by Month.
-
Leave Cost (USD) by Month.
📂 What’s Inside the Employee Leave Dashboard in Power BI
When you download this tool, you’ll receive:
-
Five dashboard pages (Overview, Department, Leave Type, Reasons, Monthly Trends).
-
Interactive visuals like charts, slicers, and KPIs for faster analysis.
-
Real-time data refresh capability with Excel/HRMS integration.
-
Department-level insights for better workforce accountability.
-
Cost-tracking charts to identify where absenteeism is hitting budgets.
⚡ How to Use the Employee Leave Dashboard
1️⃣ Connect Data Sources – Import from Excel, HRMS, or payroll systems.
2️⃣ Navigate Pages – Use slicers and charts to explore leave insights.
3️⃣ Check Overview – Start with high-level KPIs for quick understanding.
4️⃣ Drill Into Departments – Identify which teams are driving absenteeism.
5️⃣ Analyze Leave Types – Spot long-duration or unplanned leave patterns.
6️⃣ Review Monthly Trends – Forecast staffing and seasonal leave cycles.
7️⃣ Share Reports – Export or publish dashboards for HR and leadership.
🎯 Who Can Benefit from the Employee Leave Dashboard?
-
👥 HR Managers – Gain visibility into leave balances and problem areas.
-
💼 Executives – Monitor workforce availability and productivity.
-
📊 Finance Teams – Track leave costs for budgeting and cost control.
-
🏢 Department Heads – Manage team-level productivity.
-
🌍 Small & Large Businesses – Scalable for organizations of all sizes.
✅ Why Choose This Dashboard?
-
📊 Centralized Reporting – All leave data in one place.
-
⚡ Real-Time Insights – No more manual updates.
-
✔ Better Decision-Making – Instantly detect problem areas.
-
💰 Cost Control – Track and reduce absenteeism costs.
-
📈 Forecasting Ability – Predict seasonal trends for workforce planning.
-
🤝 Improved Accountability – Transparent reporting across teams.
-
🧑🤝🧑 Healthier Work Culture – Take proactive steps with HR insights.
📖 Click here to read the Detailed blog post
📺 Visit our YouTube channel to learn step-by-step video tutorials


Reviews
There are no reviews yet.