
A safe workplace isn’t just a legal requirement—it’s a commitment to your people. The Employee Health and Safety Report in Excel is a powerful, ready-to-use tool designed to help you track workplace incidents, analyze severity levels, and implement preventive actions. Perfect for HR professionals, safety managers, and compliance teams, this interactive report ensures that no incident goes unnoticed and that you stay ahead of risks—visually and in real-time.
🔍 What’s Included in the Report?
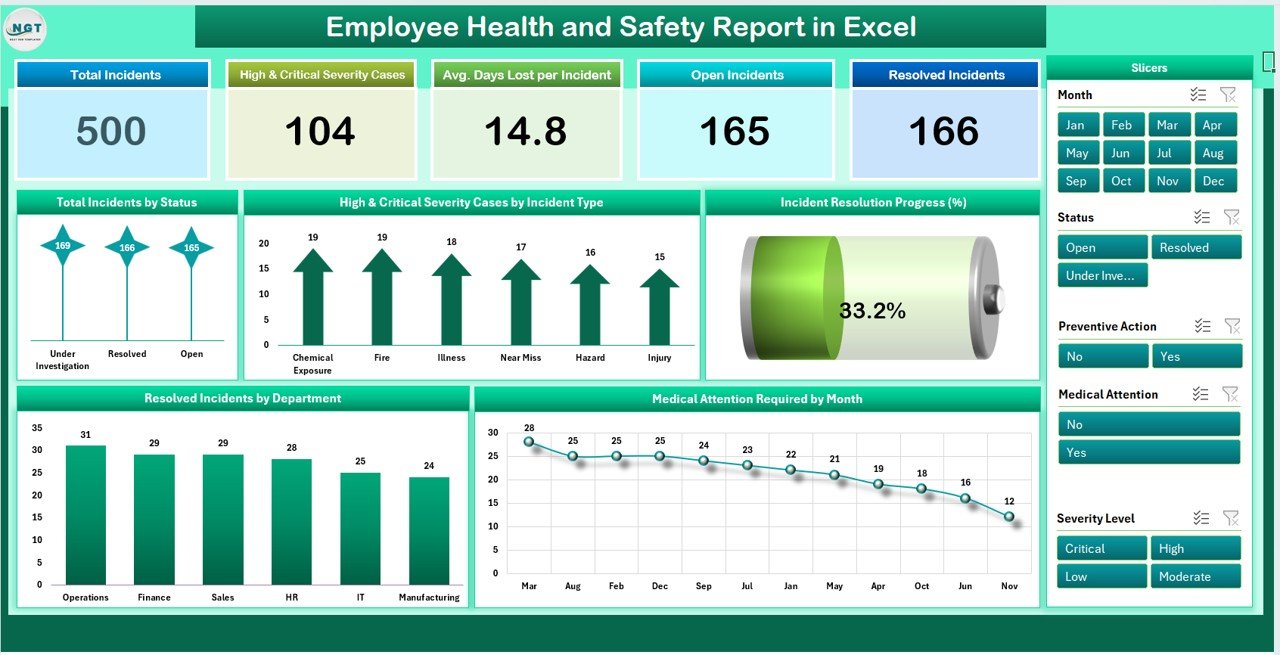
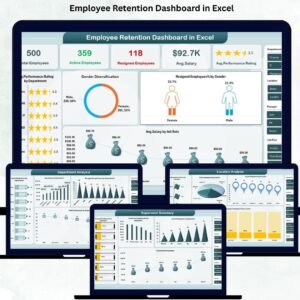
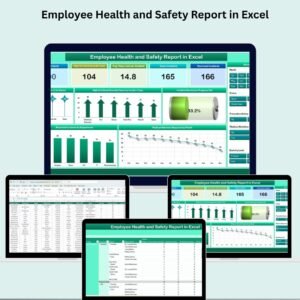
📊 1. Summary Sheet Tab – Interactive Safety Dashboard
This is the main reporting interface where you’ll find:
💡 Metric Cards:
-
🚨 Total Incidents – Total number of reported incidents
-
🔴 High & Critical Severity Cases – Count of severe incidents
-
🕒 Avg. Days Lost per Incident – Productivity impact analysis
-
🟡 Open Incidents – Cases still under resolution
-
✅ Resolved Incidents – Successfully addressed incidents
📈 Charts & Visuals:
-
📌 Total Incidents by Status – View open, resolved, and pending cases
-
🔥 Severity by Incident Type – Breakdown of serious incidents
-
📉 Incident Resolution Progress (%) – Track your resolution rate
-
🏥 Medical Attention Required by Month – Monthly medical cases trend
-
🏢 Resolved Incidents by Department – Identify top-performing departments
With real-time data reflection and compelling visuals, this sheet empowers you to take swift and informed safety decisions.
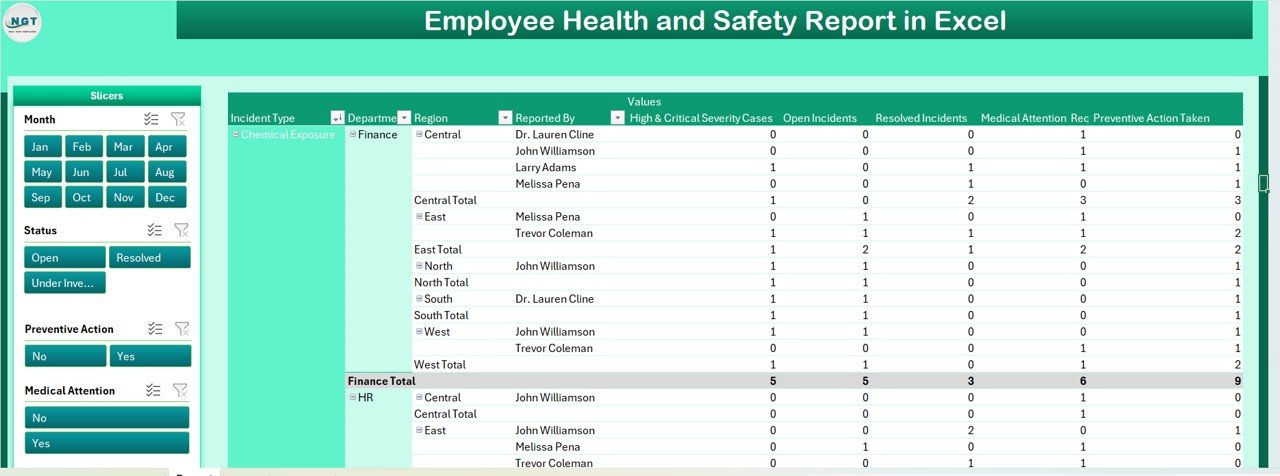
🗂️ 2. Report Sheet Tab – Pivot Table Analysis
This tab turns raw data into filterable, drill-down reports:
-
✅ Pivot Tables – Slice the data by department, incident type, severity, and more
-
🔘 Slicers – Interactive filters by Year, Month, Region, Severity Level, and Status
Ideal for audits, compliance reports, and trend analysis, this tab gives you complete control over safety data exploration.
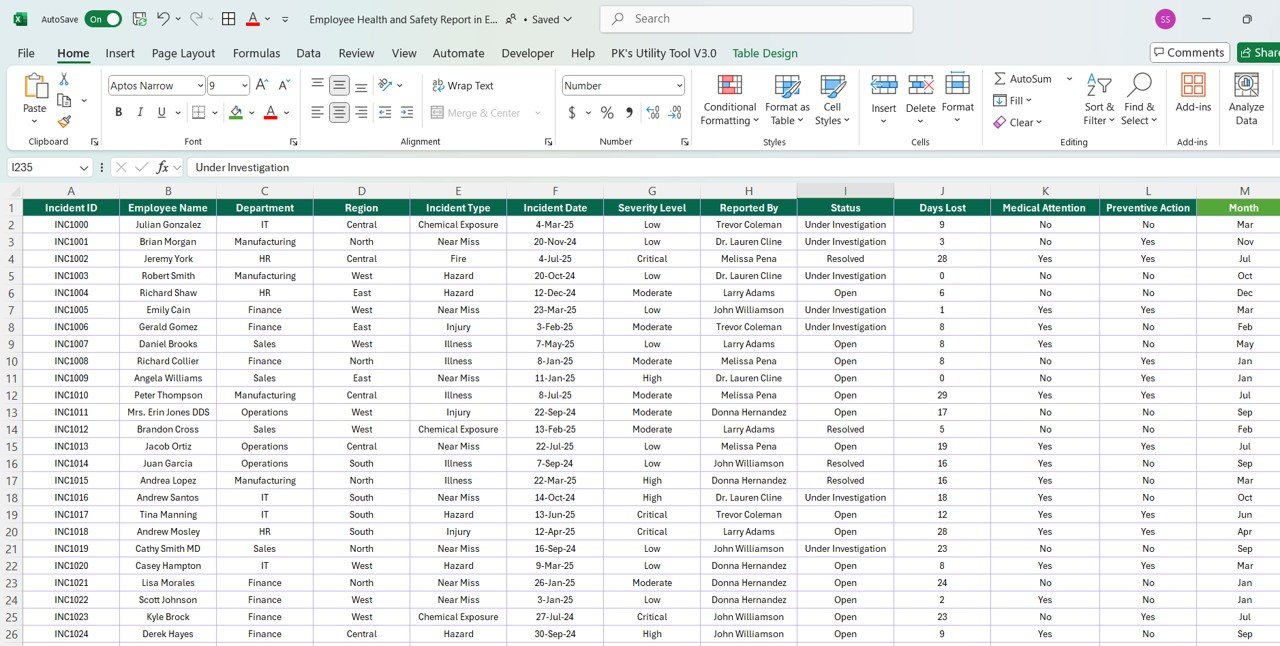
📝 3. Data Sheet Tab – Centralized Incident Log
This is where all incident information is entered and updated. Key fields include:
-
📅 Incident Date
-
🧑💼 Employee Name & Department
-
🌍 Region
-
🧯 Incident Type (e.g., slip and fall, chemical exposure)
-
🚦 Severity Level (Low, Medium, High, Critical)
-
🙋 Reported By
-
📌 Status (Open, Resolved, Under Review)
-
⏳ Days Lost
-
🚑 Medical Attention Required? (Yes/No)
-
🛠️ Preventive Action Taken? (Yes/No)
-
📊 Summary Metrics auto-calculated from the data
This sheet powers the whole report, enabling automated updates and streamlined data management.
🎯 Key Benefits of the Health and Safety Report in Excel
✅ Centralized & Organized
Keep all incident data in one place with structured fields and dropdowns—no more scattered spreadsheets.
📈 Visual Analytics
Monitor performance via dynamic charts and progress bars to assess compliance and track improvements.
⏱️ Real-Time Insights
As you update incident data, all visuals and KPIs update automatically—no formulas required.
📊 Pivot-Based Drilldown
Quickly generate department- or region-specific reports using built-in pivot tables and slicers.
👥 Team Collaboration Ready
Easily share with HR, management, and safety officers for collaborative planning and action.
⚙️ Fully Customizable
Add columns, change visual elements, or create new filters—the template adapts to your organization’s needs.
👩⚕️ Who Should Use This Tool?
-
🏢 HR & Compliance Teams – For internal reporting & audits
-
🦺 Health & Safety Managers – Monitor safety program performance
-
🏭 Operations Supervisors – Track site-specific incidents
-
🧑💻 Business Analysts – Identify risk patterns and mitigation needs
-
📋 Facility Admins – Record and document preventive measures
🚀 How to Use the Report
-
📝 Enter new incidents in the Data Sheet Tab
-
📊 Switch to the Summary Sheet to view visual KPIs and trends
-
🔍 Use the Report Sheet for custom analysis with filters
-
🤝 Share or export findings for compliance, audits, or safety meetings


Reviews
There are no reviews yet.