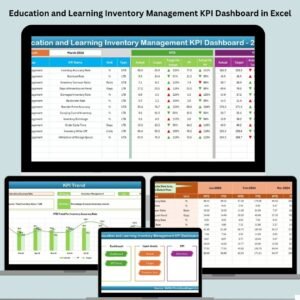
This powerful, Excel-based tool is tailor-made for the education sector to simplify inventory monitoring, enhance resource planning, and ensure smart, data-driven decision-making Education and Learning Inventory Management KPI Dashboard
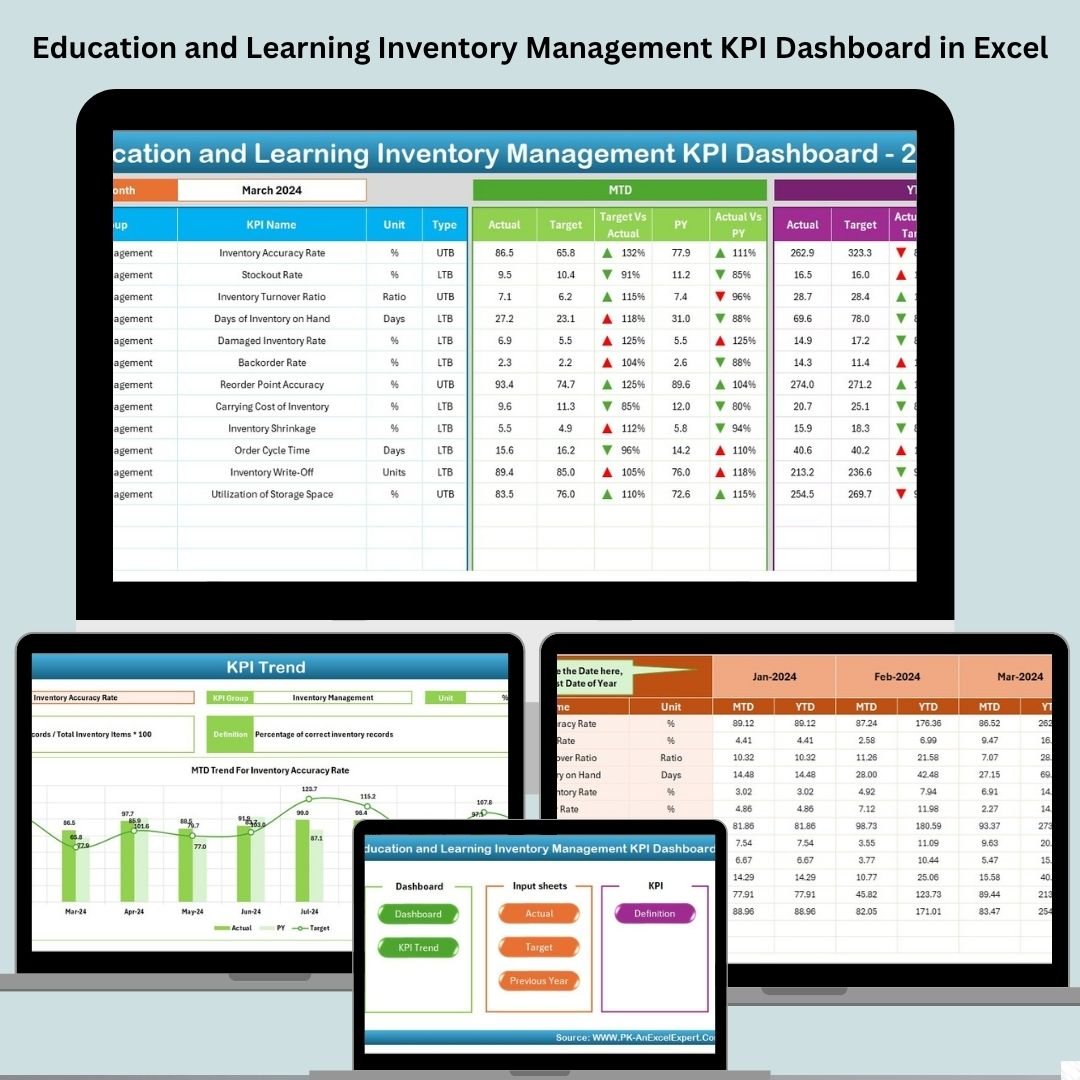
With a clean interface, clickable buttons, trend charts, and monthly/YTD comparisons, this dashboard gives you 360° visibility into your inventory performance—without needing technical knowledge or expensive software.
✨ Key Features of Education and Learning Inventory Management KPI Dashboard
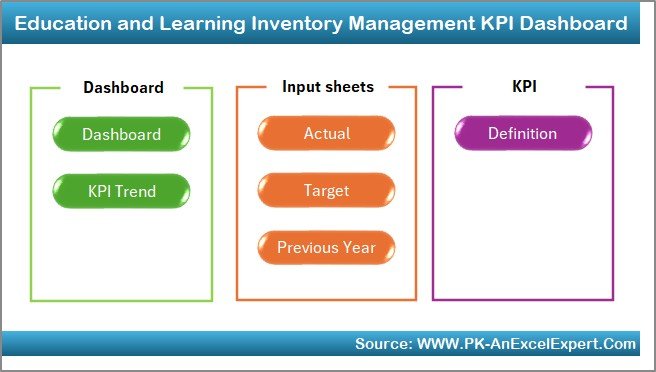
📌 7 Organized Worksheets
From data entry to dashboard view, every sheet is designed for a specific function to keep things simple and streamlined.
🎯 Interactive Dashboard Sheet
Shows all KPIs with dynamic MTD, YTD, and Previous Year comparisons. Color-coded arrows and charts make trends visually clear.
🧮 Automated Metrics
Just update the monthly values—formulas and charts update automatically, saving you hours of work.
🔁 Dropdown Filters
Select a specific month to focus your analysis using the dropdown filter at cell D3.
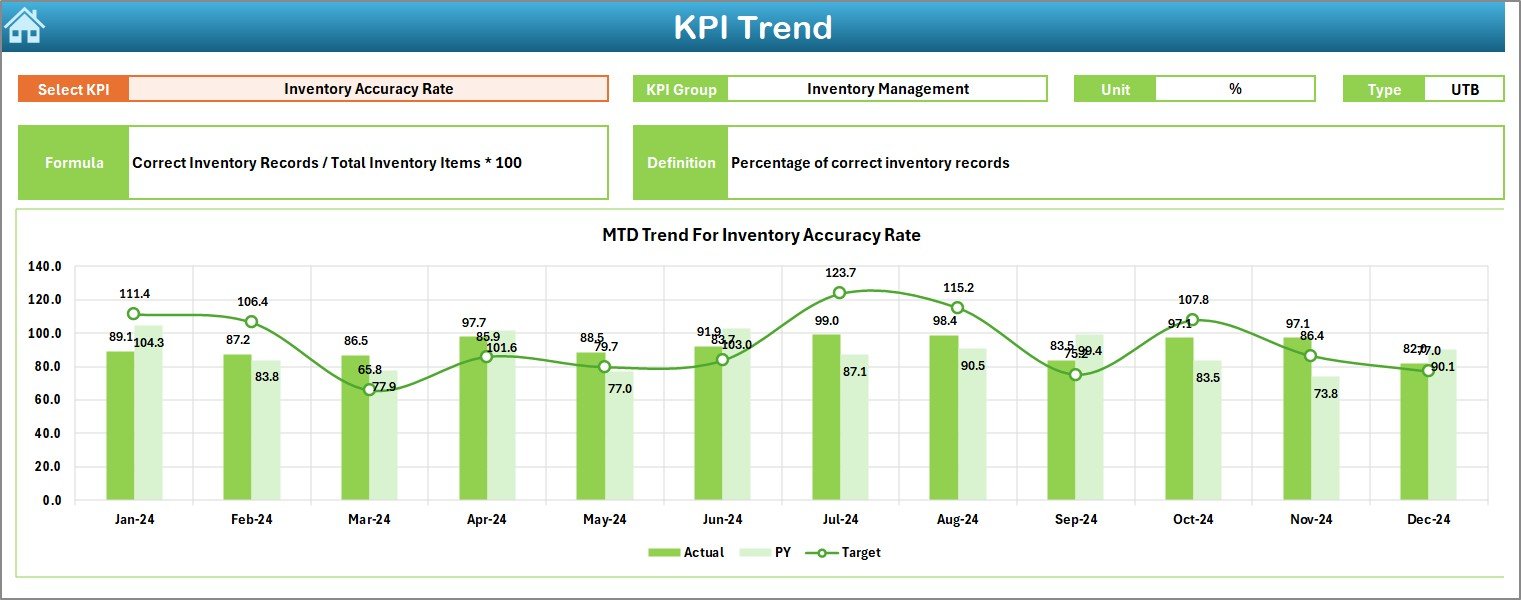
📈 KPI Trend Sheet
Track monthly KPI trends and visualize changes in Actuals, Targets, and Previous Year values for smarter forecasting.
📊 Separate Input Sheets
Cleanly separated tabs for Actuals, Targets, and Previous Year values—organized for easy data input.
📋 KPI Definition Sheet
Keep your entire team aligned with standardized definitions, formulas, and goals for each KPI.
📦 What’s Inside the Product
-
🏠 Home Sheet – Quick links to jump between sheets
-
📊 Dashboard Tab – Your visual performance center
-
🔍 KPI Trend Sheet – Analyze changes month-over-month
-
✍️ Actual Input Sheet – Input real monthly/YTD figures
-
🎯 Target Sheet – Define MTD & YTD targets for each KPI
-
📆 Previous Year Data Sheet – Add past values for comparison
-
🧾 KPI Definition Sheet – Track unit, type (UTB/LTB), and formula
🛠️ How to Use the Product
1️⃣ Start with the Home Sheet
Use the buttons to navigate effortlessly across the dashboard.
2️⃣ Update Data Monthly
Input actual numbers, targets, and last year’s data in their respective sheets.
3️⃣ Review the Dashboard
Use the drop-down in cell D3 to pick a month and review all trends and gaps.
4️⃣ Analyze Trends
Go to the KPI Trend Sheet to see detailed monthly performance for each KPI.
5️⃣ Adjust Targets as Needed
Use the Target Sheet to realign procurement and planning goals.
6️⃣ Customize Definitions
In the Definition Sheet, modify or add new KPIs with ease.
👥 Who Can Benefit from This Product
📚 School and College Administrators
🏫 Inventory Officers
📦 Procurement Managers
🧑🏫 Academic Coordinators
💼 Education Consultants
📈 Budget and Planning Teams
🎓 Training Institutes and Coaching Centers
Whether you manage a school’s supply chain or oversee an academic department’s equipment needs—this tool is for you.
📖 Click here to read the Detailed blog post
🎥 Visit our YouTube channel to learn step-by-step video tutorials
👉 youtube.com/@PKAnExcelExpert













Reviews
There are no reviews yet.