


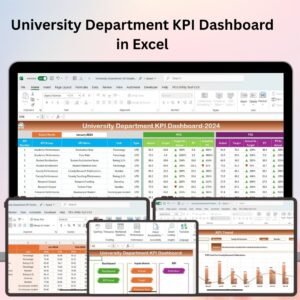
The University Department KPI Dashboard in Excel is an essential tool for academic administrators, department heads, and university managers to track and monitor key performance indicators (KPIs) related to the performance and effectiveness of university departments. This Excel-based dashboard allows you to measure academic performance, student satisfaction, faculty efficiency, and departmental financial health, enabling you to make data-driven decisions that optimize operations and improve the quality of education.
With real-time tracking, customizable visuals, and an easy-to-use interface, this dashboard helps you manage academic activities, faculty performance, student engagement, and departmental budgets efficiently.

Key Features of the University Department KPI Dashboard in Excel:
📚 Academic Performance Tracking
Monitor key academic performance indicators such as average grades, graduation rates, and student retention, ensuring that your department meets academic excellence standards.
👨🏫 Faculty Performance and Engagement
Track faculty performance, including teaching quality, student feedback, and research output, helping you evaluate and improve faculty effectiveness.
📊 Student Satisfaction and Engagement
Monitor student satisfaction through surveys and feedback, track student participation in departmental activities, and ensure that students are actively engaged in their learning environment.
💰 Departmental Budget and Financial Health
Track departmental income and expenses, including funding, grants, and research budgets, ensuring that the department operates within budget and remains financially stable.
📅 Course and Curriculum Management
Track course completion rates, curriculum updates, and scheduling to ensure that the department is delivering high-quality courses and staying on track with academic goals.
🚀 Why You’ll Love the University Department KPI Dashboard in Excel:
✅ Optimize Academic Performance – Track student grades, retention, and graduation rates to ensure that your department is meeting academic goals and delivering high-quality education.
✅ Enhance Faculty Performance – Monitor faculty performance, feedback, and research output to ensure that faculty members are meeting teaching and research standards.
✅ Increase Student Engagement – Track student satisfaction, participation, and engagement to create a more supportive and effective learning environment.
✅ Maintain Financial Stability – Keep track of departmental budgets, income, and expenses to ensure that your department remains financially efficient and sustainable.
✅ Customizable and User-Friendly – Fully customizable to meet your university department’s specific needs, with easy-to-navigate features that ensure seamless tracking.
✅ Data-Driven Decision Making – Use the data and insights gathered from the dashboard to improve decision-making, allocate resources efficiently, and enhance the overall performance of your department.
What’s Inside the University Department KPI Dashboard in Excel:
-
Academic Performance Tracking: Monitor student grades, retention rates, graduation rates, and course completion rates to ensure that the department meets its academic objectives.
-
Faculty Performance Monitoring: Track faculty performance metrics such as teaching evaluations, research contributions, and student feedback to evaluate and improve faculty effectiveness.
-
Student Engagement and Satisfaction: Monitor student satisfaction surveys, feedback, and participation in departmental activities to ensure that students remain engaged and satisfied with their academic experience.
-
Departmental Financial Health: Track departmental income, expenses, and funding sources, ensuring that the department remains within budget and financially stable.
-
Course Management: Track the performance of courses, including completion rates and curriculum updates, ensuring that courses are being delivered as planned and meet academic standards.
-
Custom Reports: Generate detailed reports summarizing key KPIs, academic performance, and financial data, providing valuable insights for academic decision-making and departmental planning.
How to Use the University Department KPI Dashboard in Excel:
1️⃣ Download the Template – Instantly access your Excel file upon purchase.
2️⃣ Input Department Data – Enter departmental data, including academic performance, faculty information, student satisfaction, budget details, and course data.
3️⃣ Monitor KPIs – Use the dashboard to monitor academic performance, faculty metrics, student engagement, and financial health in real-time.
4️⃣ Analyze Performance Trends – Track performance trends in academic outcomes, faculty performance, and student satisfaction, identifying areas for improvement.
5️⃣ Generate Reports – Create customized reports summarizing departmental performance, financial health, and student outcomes for management review.
Who Can Benefit from the University Department KPI Dashboard in Excel:
-
University Department Heads
-
Academic Administrators
-
Faculty Managers
-
HR and Student Engagement Teams
-
Financial Managers in Academic Institutions
-
Deans and Vice-Chancellors
-
Small to Large Educational Institutions
-
University and College Managers
The University Department KPI Dashboard in Excel is a must-have tool for higher education institutions looking to improve departmental performance, track student outcomes, and ensure financial stability. Whether you manage a single department or oversee multiple academic divisions, this dashboard helps you ensure academic excellence and operational efficiency.
Click here to read the Detailed blog post
https://www.pk-anexcelexpert.com/university-department-kpi-dashboard-in-excel/
Visit our YouTube channel to learn step-by-step video tutorials
Youtube.com/@PKAnExcelExpert


Reviews
There are no reviews yet.