

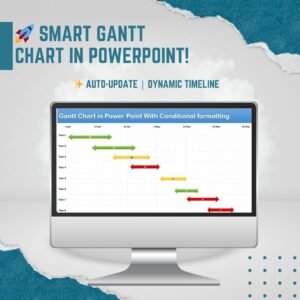
Are you tired of manually updating project timelines in PowerPoint? The Data-Driven Gantt Chart in PowerPoint is the perfect solution for project managers, teams, and professionals who need a dynamic, easy-to-update, and visually engaging project tracking tool. This template allows you to integrate real-time project data, automatically generating Gantt charts without the hassle of manual adjustments.
Why Choose This Data-Driven Gantt Chart?
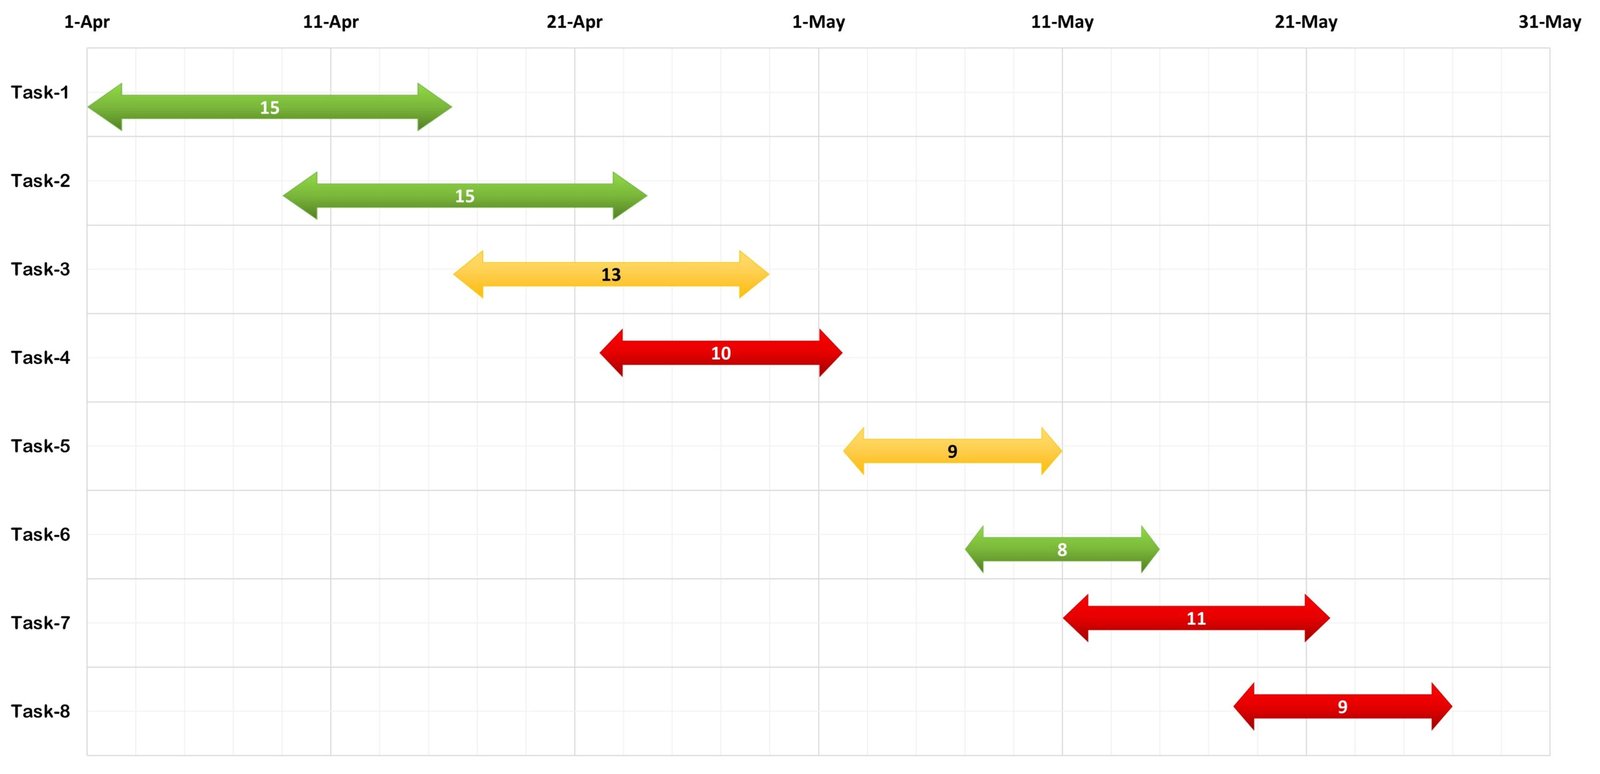
This PowerPoint-based Gantt Chart is designed to make project tracking and reporting effortless. It features interactive data linking, meaning you can update task durations, start and end dates, and progress without redesigning your slides. Ideal for presentations, stakeholder meetings, and progress updates, this chart enhances clarity and decision-making.
Key Features:
✅ Data-Driven Updates: Change the project timeline directly in Excel, and PowerPoint will update automatically.
✅ Customizable Design: Adjust colors, labels, and formats to match your project’s needs.
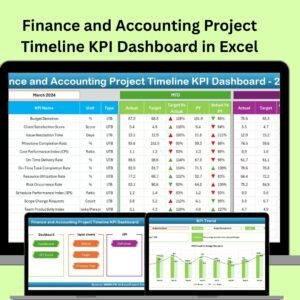
✅ Conditional Formatting: Automatically highlight delays, completed tasks, or upcoming deadlines.
✅ Animated Transitions: Make presentations engaging with smooth visual effects.
✅ Professional Look: Sleek and modern design suitable for corporate reports and executive summaries.
How It Works
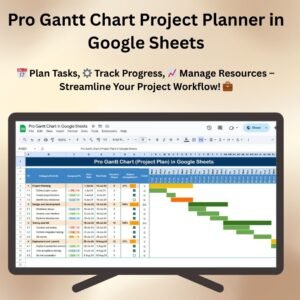
1️⃣ Enter your project data in the linked Excel sheet (task name, start date, duration).
2️⃣ PowerPoint updates automatically, generating a professional Gantt chart.
3️⃣ Customize as needed by adjusting colors, animations, and styles.
4️⃣ Present with confidence in meetings, reports, or stakeholder updates.
Perfect for:
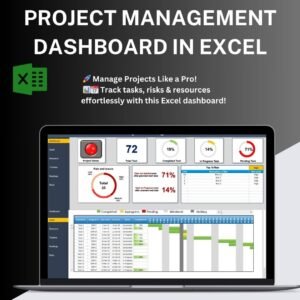
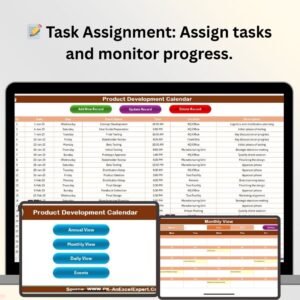
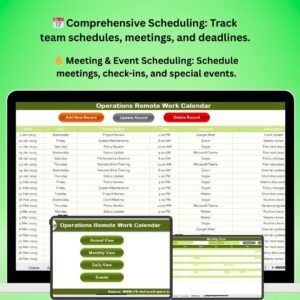
📌 Project Managers – Easily track tasks, milestones, and deadlines.
📌 Consultants & Analysts – Create stunning reports in minutes.
📌 Executives & Teams – Improve decision-making with clear project visualization.
📌 Students & Educators – Use for project planning, research, and academic presentations.
Take Control of Your Projects Today!
Upgrade your presentations with a professional, automated Gantt chart that saves time and improves clarity. Download now and streamline your project tracking like a pro!
Click here to read the detailed blog post:
Watch the step-by-step video tutorial:
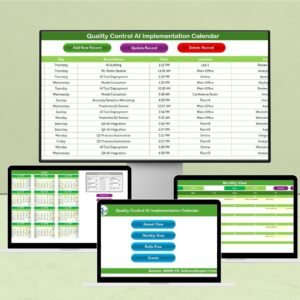
Also check our Quality checklist template in Excel


Reviews
There are no reviews yet.