


Understanding how customers interact with your brand at every stage is essential for growth, retention, and long-term success. However, many organizations still struggle to get a complete view of the customer journey. Data often remains scattered across marketing tools, CRM systems, support platforms, and spreadsheets. As a result, teams miss critical insights, customer drop-off points remain hidden, and experience improvements become reactive instead of strategic.
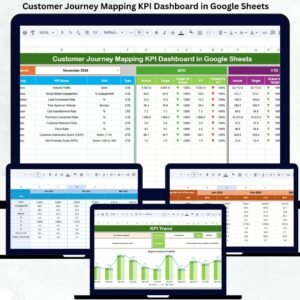
The Customer Journey Mapping KPI Dashboard in Google Sheets solves this challenge by providing a structured, data-driven, and easy-to-use system for tracking customer journey performance from start to finish. This ready-to-use dashboard converts customer interaction data into meaningful KPIs, comparisons, and trends—helping teams understand what works, what does not, and where improvement is required.
Because the dashboard runs entirely in Google Sheets, it remains flexible, collaborative, and cost-effective. Teams can update data in real time, collaborate across departments, and analyze performance without relying on complex BI tools or expensive software.
🚀 Key Features of the Customer Journey Mapping KPI Dashboard
🧭 End-to-End Journey Visibility
Track customer performance across awareness, consideration, onboarding, usage, support, and retention stages.
📊 MTD, YTD & YoY Performance Tracking
Monitor Month-to-Date, Year-to-Date, Target, and Previous Year comparisons clearly.
📈 KPI Trend Analysis
Understand long-term behavior patterns and journey improvements over time.
🎯 Target vs Actual Monitoring
Identify gaps between expected and actual customer experience performance.
🧩 Central KPI Definition Control
Ensure consistency with a structured KPI Definition sheet.
🔍 Clear Visual Indicators
Instantly spot improvements and declines using arrow-based conditional formatting.
📦 What’s Inside the Customer Journey Mapping KPI Dashboard
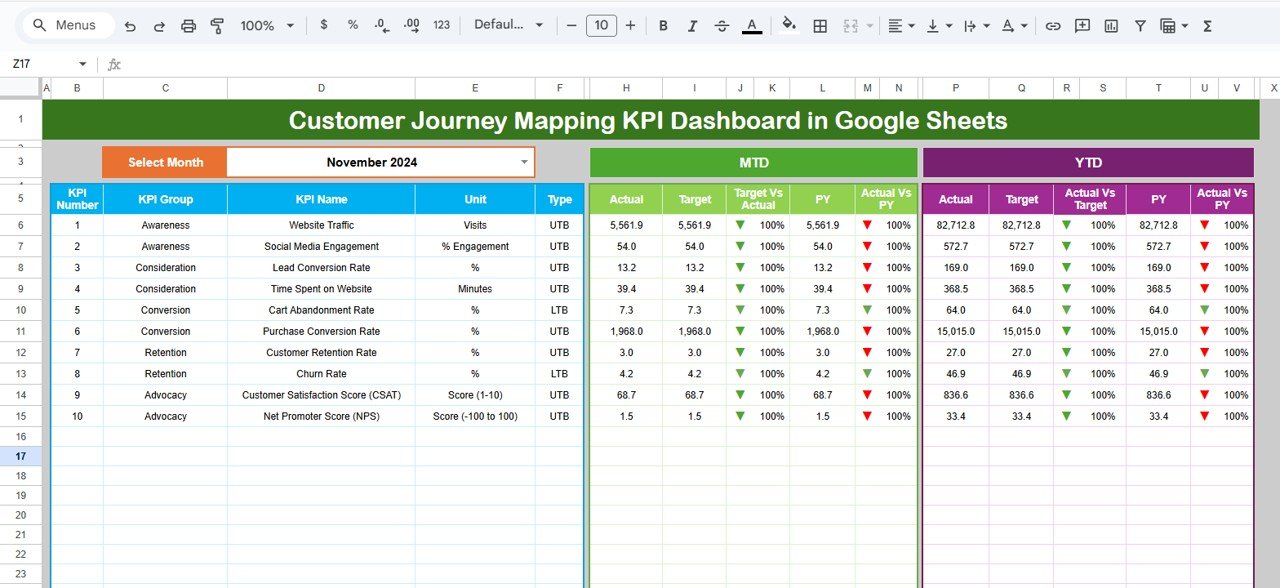
📊 Dashboard Sheet – Main Control Panel
The Dashboard Sheet provides a complete snapshot of customer journey performance.
Month Selector
-
Located in cell D3
-
Selecting a month automatically refreshes all KPIs
KPI Comparisons Displayed
For each KPI, the dashboard shows:
MTD (Month-to-Date):
-
Actual
-
Target
-
Previous Year
-
Target vs Actual
-
Previous Year vs Actual
YTD (Year-to-Date):
-
Actual
-
Target
-
Previous Year
-
Target vs Actual
-
Previous Year vs Actual
Conditional Formatting
-
🟢 Green arrow → Improvement
-
🔴 Red arrow → Decline
-
⚪ Neutral indicator → Stable
This allows leadership to understand customer journey health in seconds.
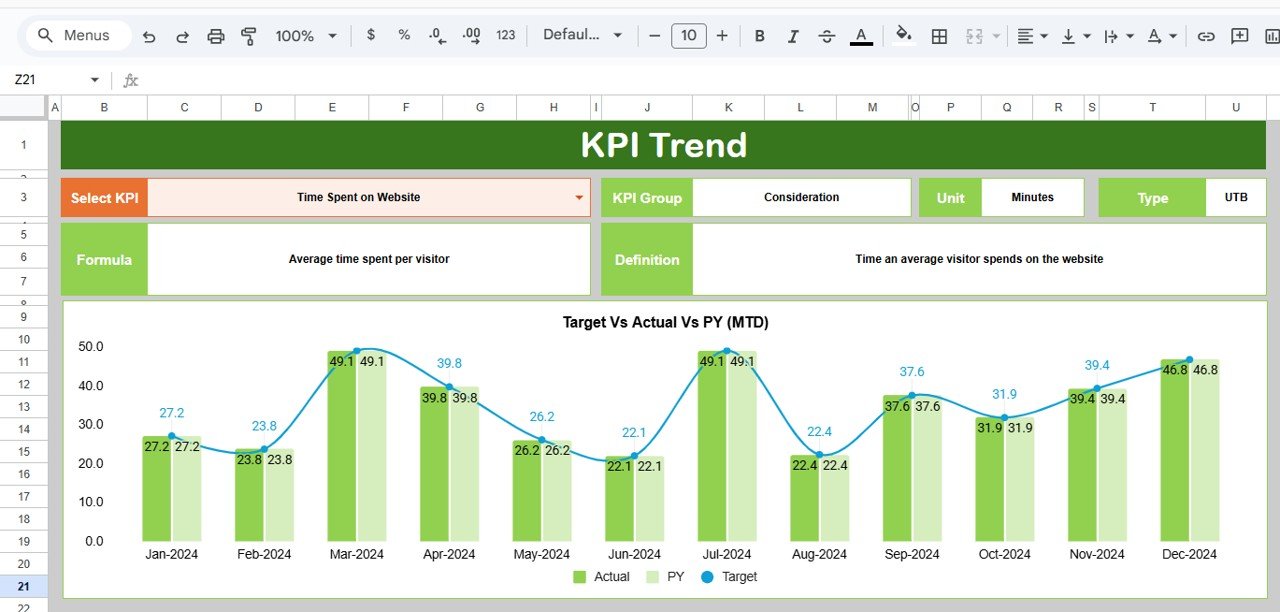
📈 KPI Trend Sheet
This sheet focuses on deep analysis of individual KPIs.
Features Include:
-
KPI selection dropdown in cell C3
-
Displays:
-
KPI Group
-
Unit
-
KPI Type (LTB / UTB)
-
Formula
-
Definition
-
-
Month-wise trend chart for the selected KPI
This sheet helps teams identify friction points and long-term experience trends.
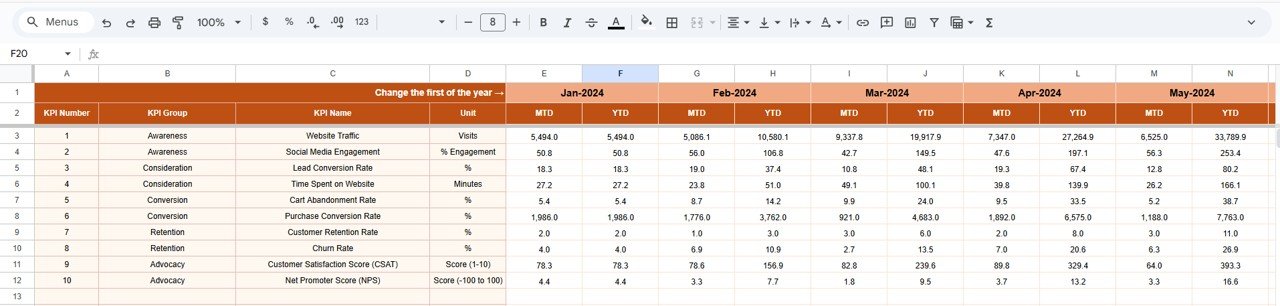
🧮 Actual Number Sheet
This sheet stores actual KPI values.
How It Works:
-
Select the first month of the year in cell E1
-
Enter MTD and YTD actual values
-
All dashboards update automatically
This ensures accurate and structured data input.
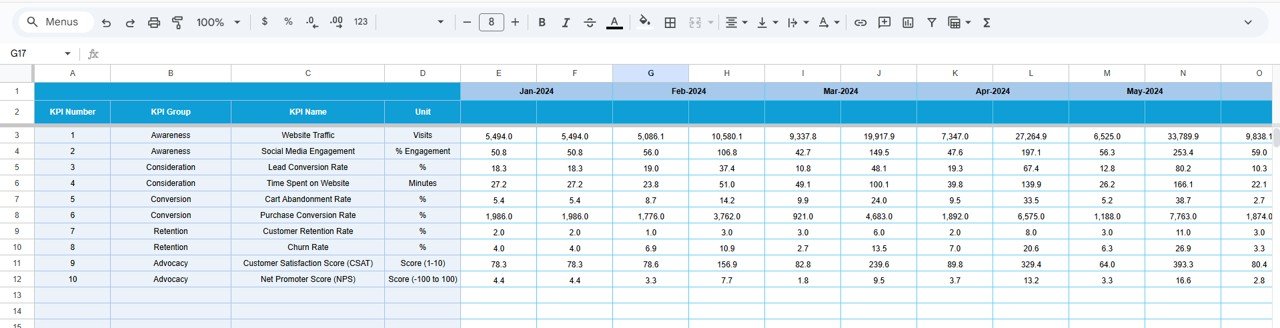
🎯 Target Sheet
The Target Sheet stores performance benchmarks.
Purpose:
-
Define monthly and annual goals
-
Measure performance against expectations
-
Drive accountability across teams
Targets can be customized per KPI based on business priorities.
📅 Previous Year Number Sheet
This sheet captures historical KPI values.
Benefits:
-
Enables year-over-year comparison
-
Shows improvement or decline clearly
-
Supports long-term journey analysis
📘 KPI Definition Sheet
This is the backbone of the dashboard.
It contains:
-
KPI Name
-
KPI Group
-
Unit
-
Formula
-
Definition
-
KPI Type (LTB / UTB)
Any update here reflects instantly across the entire dashboard.
🛠️ How to Use the Customer Journey Mapping KPI Dashboard
1️⃣ Define KPIs in the KPI Definition sheet
2️⃣ Enter actual data monthly
3️⃣ Set realistic targets
4️⃣ Review MTD, YTD, and YoY comparisons
5️⃣ Analyze KPI trends
6️⃣ Take action on journey gaps
👥 Who Can Benefit from This Dashboard
-
📣 Marketing Teams
-
🤝 Sales Teams
-
🌟 Customer Experience (CX) Teams
-
📞 Customer Success & Support Teams
-
🧑💼 Business Leaders & Management
### Click here to read the Detailed blog post
Watch the step-by-step video tutorial:


Reviews
There are no reviews yet.