


Cultural diversity is no longer just an HR initiative—it is a strategic business priority. Organizations with diverse and inclusive teams consistently outperform others in innovation, collaboration, and employee engagement. However, diversity efforts cannot succeed without accurate measurement, visibility, and accountability. When diversity data remains buried inside HR systems or static reports, leaders struggle to identify gaps, track progress, and make informed decisions.
That is exactly why the Cultural Diversity KPI Dashboard in Google Sheets becomes an essential diversity and inclusion management tool.
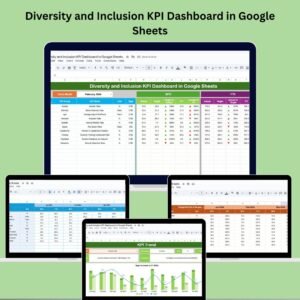
This ready-to-use dashboard enables organizations to track, analyze, and monitor cultural diversity performance using structured KPIs, targets, trends, and year-over-year comparisons. Instead of relying on disconnected reports, HR and DEI teams gain a single, transparent, and collaborative view of diversity metrics.
Because the dashboard is built in Google Sheets, it remains cloud-based, flexible, and cost-effective—without the need for complex BI tools or expensive DEI software.
🌈 Key Features of Cultural Diversity KPI Dashboard
🧑🤝🧑 Representation Tracking
Measure workforce diversity across gender, ethnicity, nationality, age groups, and inclusion indicators. The dashboard highlights representation gaps clearly so organizations can take focused action.
🎯 Target vs Actual Monitoring
Track MTD and YTD diversity performance against predefined targets. Instantly identify whether inclusion goals are on track or need attention.
📈 Year-over-Year Comparison
Compare current diversity performance with previous year data to evaluate long-term improvement and maturity.
🚦 Visual Performance Indicators
Built-in conditional arrows show improvement or decline at a glance—making leadership reviews faster and more impactful.
📦 What’s Inside the Cultural Diversity KPI Dashboard
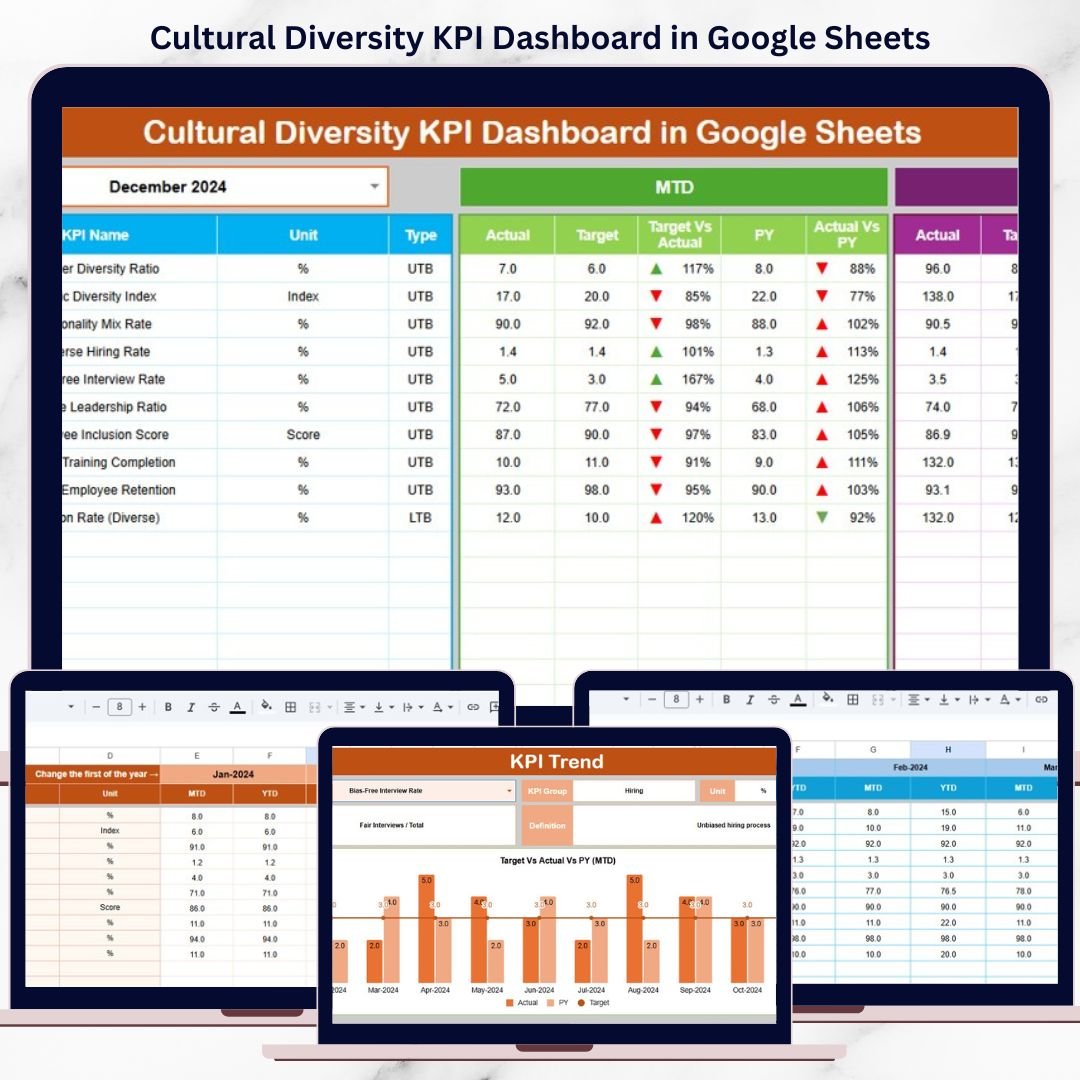
📊 Dashboard Sheet (Main Diversity Overview)
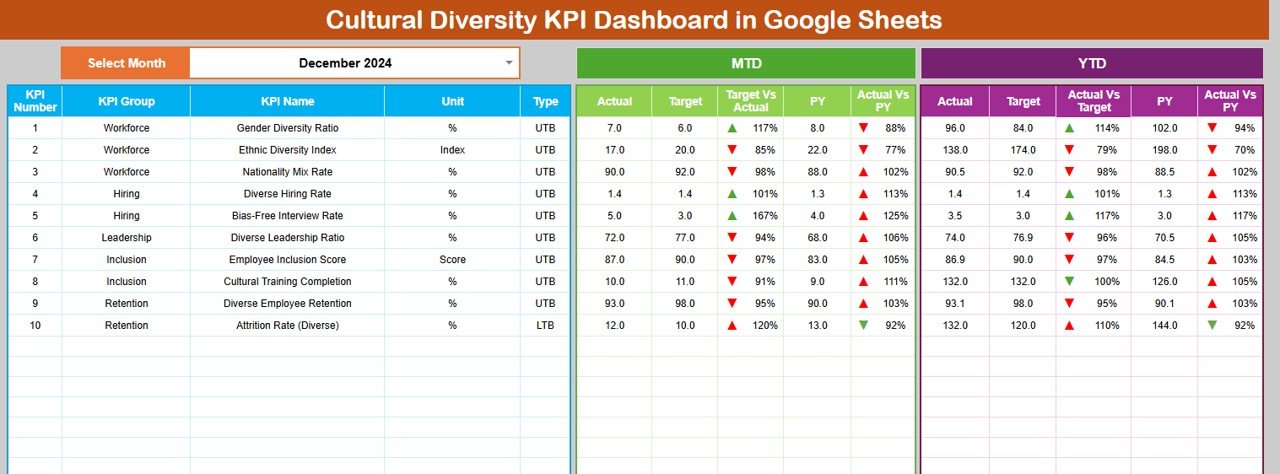
This is the executive-level summary page.
Month selection available in Cell D3
All KPIs update automatically when the month changes
Displays:
MTD Actual, Target & Previous Year
YTD Actual, Target & Previous Year
Target vs Actual
Previous Year vs Actual
Ideal for leadership reviews, DEI reporting, and board discussions
📉 KPI Trend Sheet – Deep Diversity Analysis
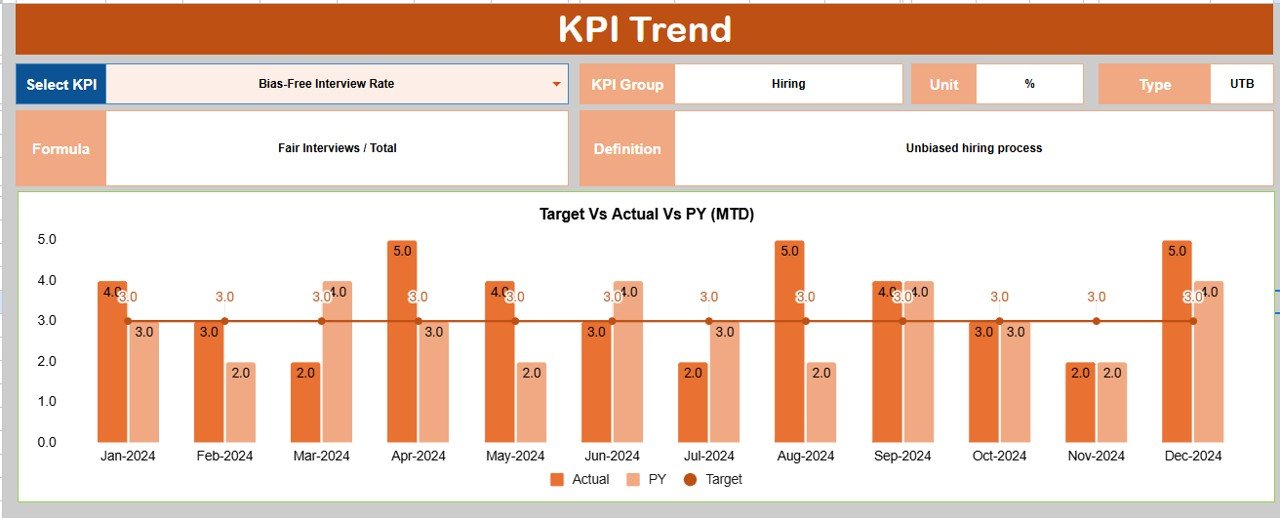
This sheet provides detailed insights into individual diversity KPIs.
Select KPI name from dropdown (Cell C3)
Displays:
KPI Group
Unit of Measurement
KPI Type (Upper / Lower the Better)
KPI Formula
KPI Definition
Month-wise trends help track progress over time
🧮 Actual Number Sheet – Real Diversity Data Entry
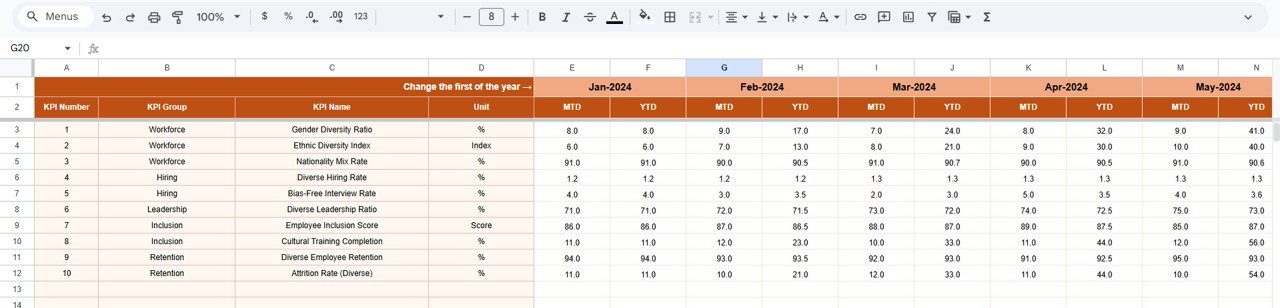
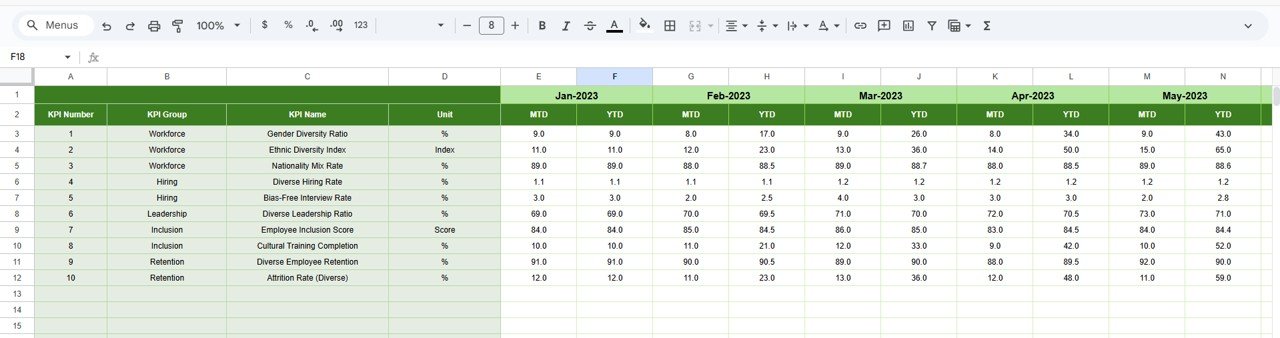
This sheet captures actual diversity values.
Select the starting month of the year in Cell E1
Enter MTD and YTD actual values
All dashboards and charts update automatically
Ensures consistent and auditable data entry
🎯 Target Sheet – Diversity Goals
Define diversity benchmarks clearly.
Monthly (MTD) targets
Annual (YTD) targets
Align diversity initiatives with organizational inclusion strategy
⏮️ Previous Year Number Sheet – Historical Benchmarking
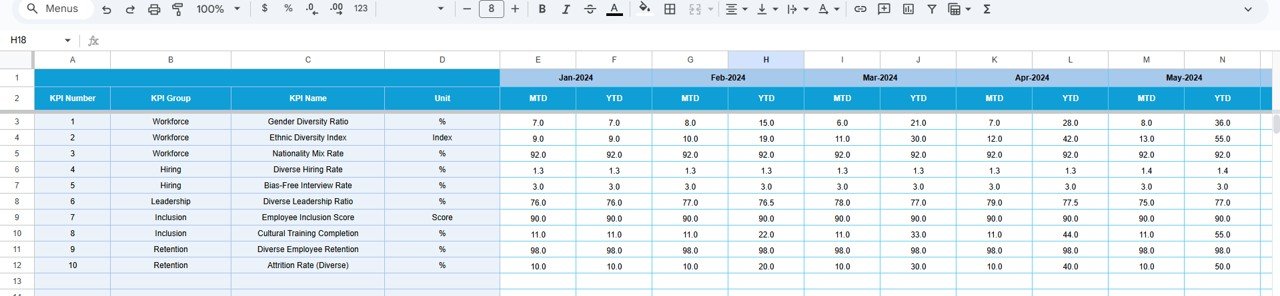
This sheet stores last year’s diversity data.
Enables year-over-year comparison
Highlights long-term diversity improvement
Supports ESG, audit, and leadership reporting
📘 KPI Definition Sheet – Diversity KPI Library
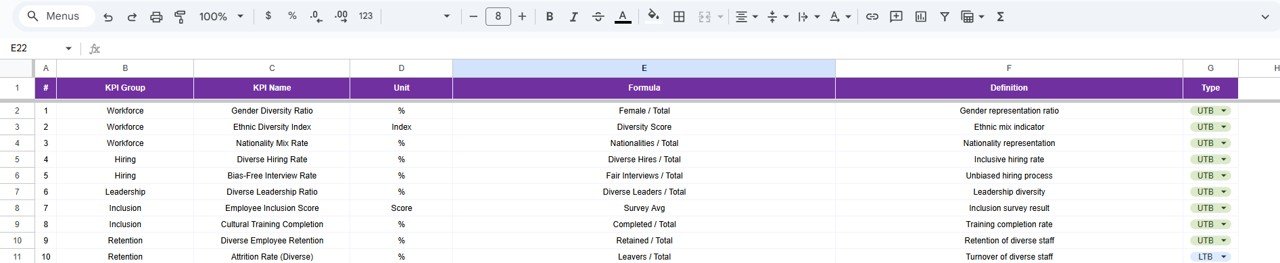
This sheet acts as the diversity KPI reference guide.
Includes:
KPI Name
KPI Group
Unit
Formula
Definition
KPI Type (UTB / LTB)
This ensures clarity, transparency, and consistency across all stakeholders.
👥 Who Can Benefit from This Cultural Diversity Dashboard
🌍 HR & People Analytics Teams
🤝 DEI & Inclusion Leaders
📊 Compliance & ESG Teams
🏢 Senior Management & Executives
📋 Audit & Reporting Teams
🌟 Advantages of Using Cultural Diversity KPI Dashboard
Centralized diversity performance tracking
Clear visibility of inclusion gaps
Data-driven DEI decision-making
Easy leadership and ESG reporting
Fully customizable KPIs
Real-time collaboration in Google Sheets
No expensive software required
🚀 Opportunities for Improvement
Intersectional diversity metrics
Supplier diversity KPIs
Anonymous inclusion survey integration
Automated HR data imports
Diversity risk indicators
🧠 Best Practices
Define diversity KPIs clearly
Set realistic and ethical targets
Update data consistently
Review trends quarterly
Protect sensitive employee data
Communicate results transparently
🔗 Click here to read the Detailed blog post
Watch the step-by-step video tutorial:
▶️ Visit our YouTube channel to learn step-by-step video tutorials
👉 https://www.youtube.com/@NeotechNavigators
Compatibility and Requirements
- Works in Google Sheets. You need a free Google account and a web browser.
- You pick the month on the Dashboard sheet and the KPI name on the KPI Trend sheet from dropdowns. Google explains dropdowns in Create an in-cell dropdown list.
Frequently Asked Questions
Which sheets are included?
Six sheets: Dashboard, KPI Trend, Actual Number, Target, Previous Year Number and KPI Definition.
How do I update the dashboard?
Enter your MTD and YTD actual values in the Actual Number sheet and your goals in the Target sheet. Then choose a month in cell D3 of the Dashboard sheet and all KPIs update.
Can I compare this year with last year?
Yes. Add last year’s figures to the Previous Year Number sheet. The Dashboard shows Previous Year next to Actual and Target for both MTD and YTD.
How do I see the trend for one KPI?
Open the KPI Trend sheet and pick the KPI name from the dropdown in cell C3. It shows the KPI group, unit, type (Upper or Lower the Better), formula and definition, with month-wise trends.
Is there an Excel or Power BI version?
Yes. See the Diversity and Inclusion KPI Dashboard in Excel and the Diversity and Inclusion KPI Dashboard in Power BI.
Related Diversity Templates
- Diversity and Inclusion KPI Dashboard in Google Sheets: a similar KPI dashboard for inclusion metrics
- Employee Diversity Dashboard in Google Sheets: a workforce view of diversity
- Employee Diversity Survey Tracker in Google Sheets: record survey responses
- Diversity and Inclusion KPI Dashboard in Excel: the Excel edition
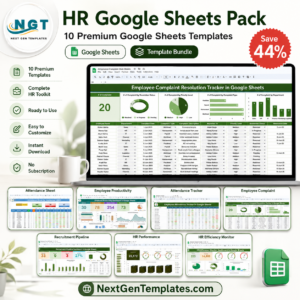
- HR Google Sheets Pack: 10 HR templates in one download
Browse all Google Sheets KPI dashboards or HR and Payroll templates in Google Sheets.































Reviews
There are no reviews yet.