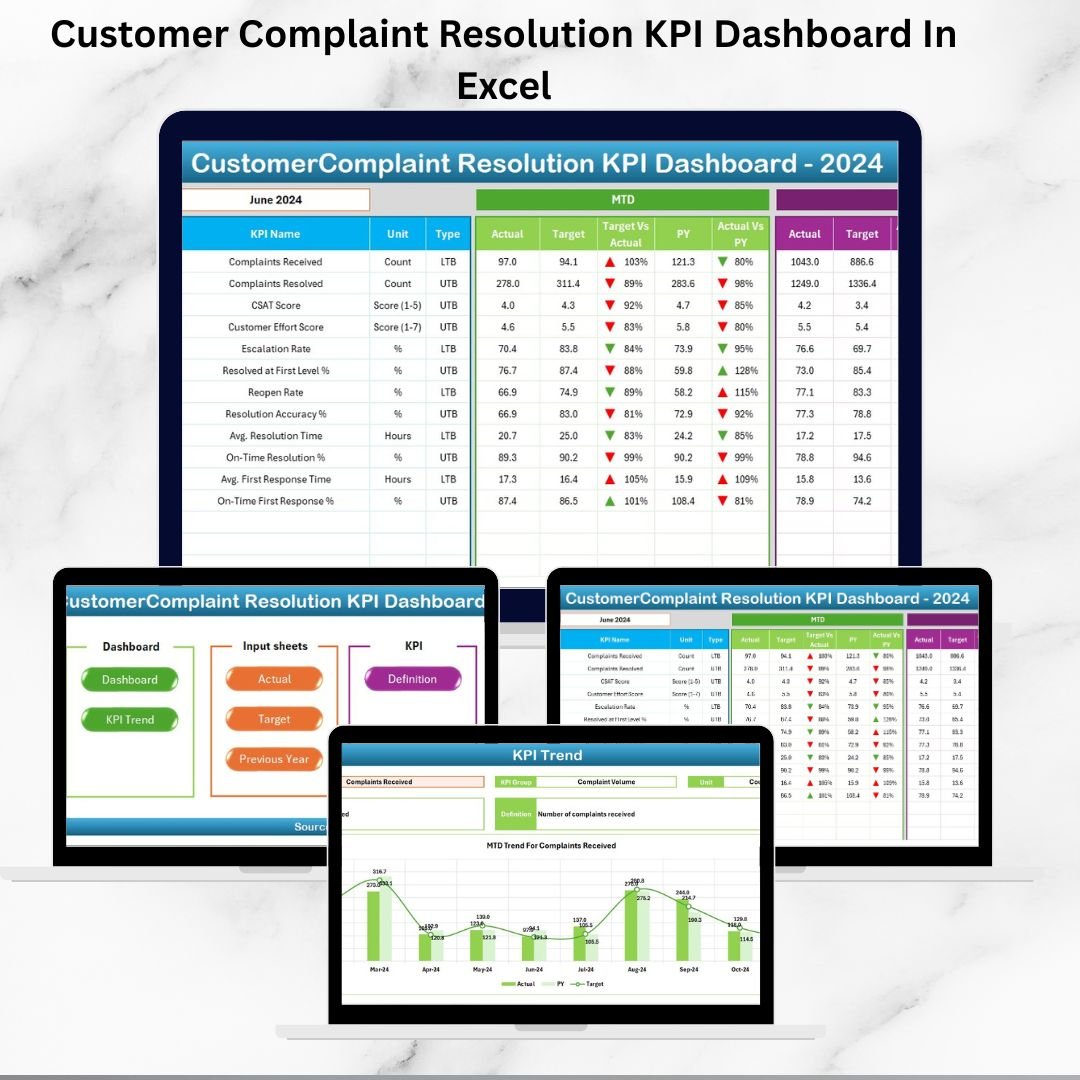
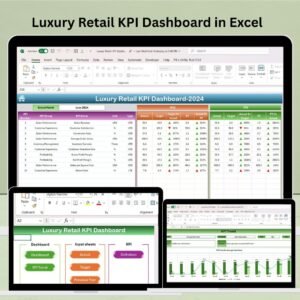
In today’s competitive market, customer complaints are more than just service issues—they’re opportunities to improve, retain clients, and build trust. If complaints aren’t handled efficiently, businesses risk losing valuable customers. That’s why the Customer Complaint Resolution KPI Dashboard in Excel is the ultimate solution for service-driven organizations.
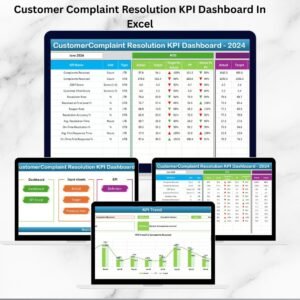
This ready-to-use Excel dashboard consolidates all the critical KPIs into one central platform, allowing you to track, measure, and improve your complaint resolution process with clarity and confidence.Customer Complaint Resolution KPI Dashboard In Excel
✨ Key Features of the Customer Complaint Resolution KPI Dashboard
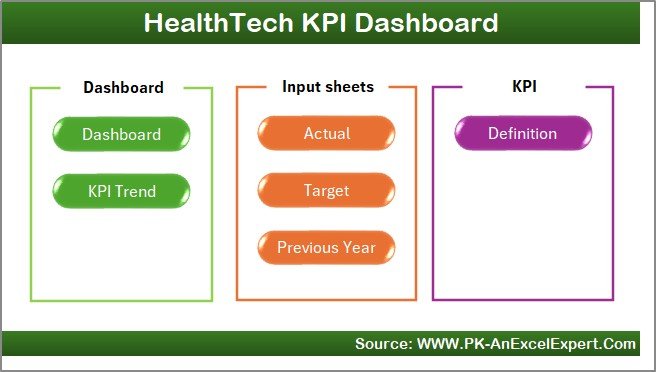
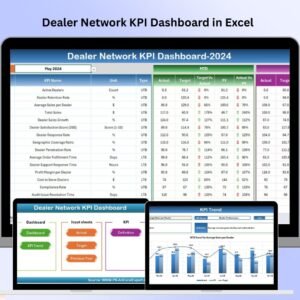
✅ 7 Interactive Sheets – Includes Home, Dashboard, KPI Trend, Actual Numbers, Target, Previous Year, and KPI Definition tabs.
✅ One-Click Navigation – Jump between sheets instantly with clickable buttons.
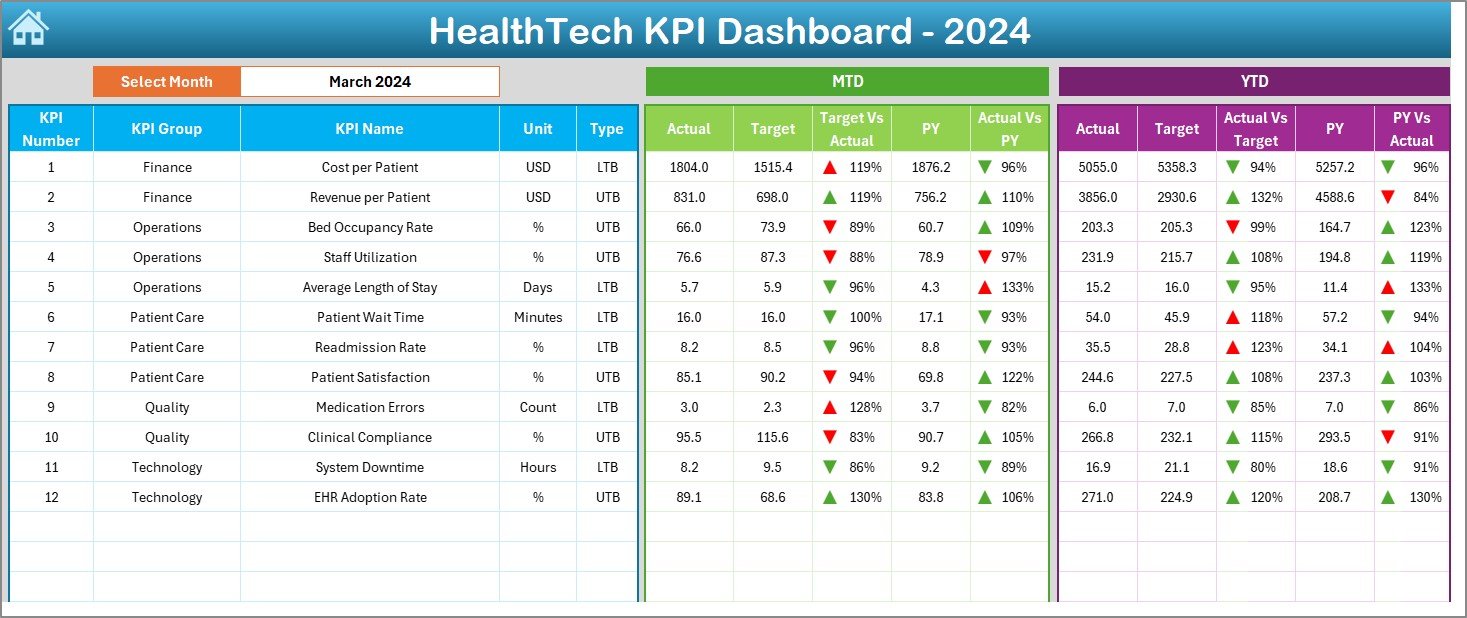
✅ Dynamic Dashboard – Select a month from the drop-down, and watch all data update automatically.
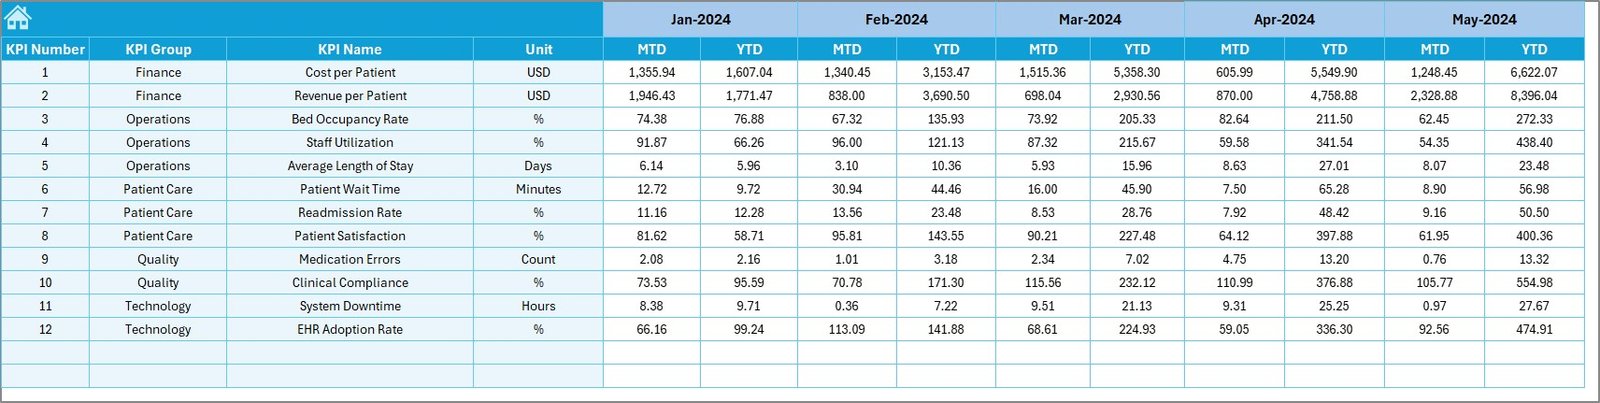
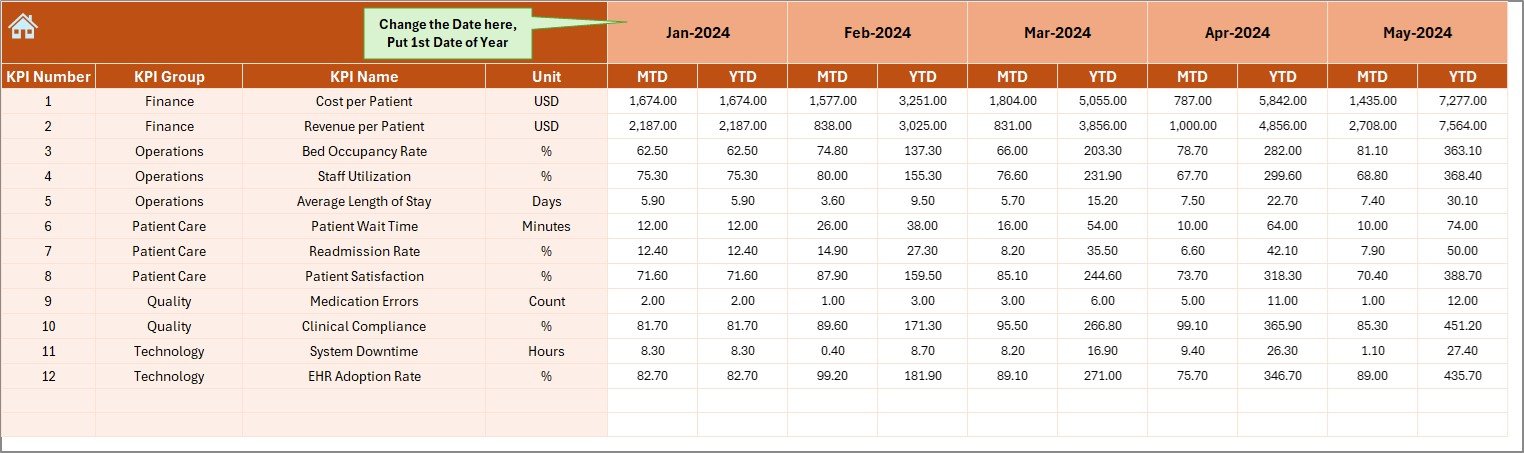
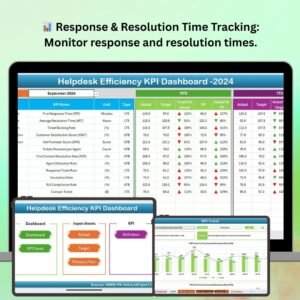
✅ MTD & YTD Analysis – Track both month-to-date and year-to-date performance.
✅ Conditional Formatting – Up/down arrows highlight performance improvements or declines.
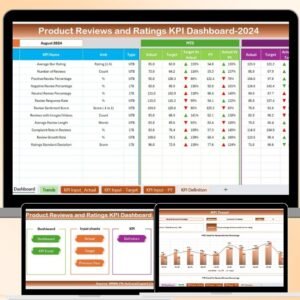
✅ Customizable Targets – Enter monthly goals for each KPI and measure achievement.
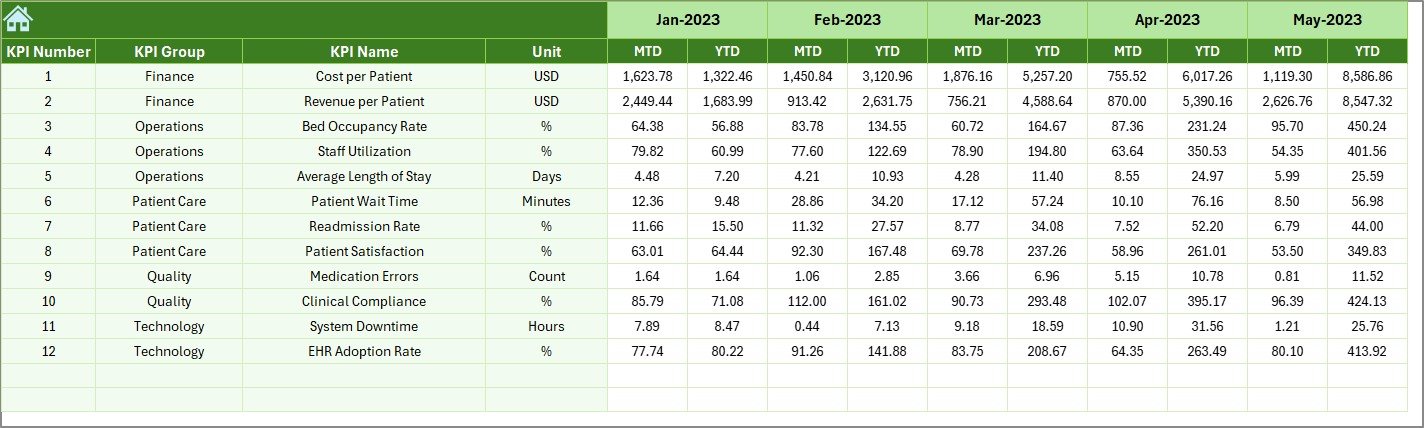
✅ Historical Comparisons – Compare actuals with previous year results for deeper insights.
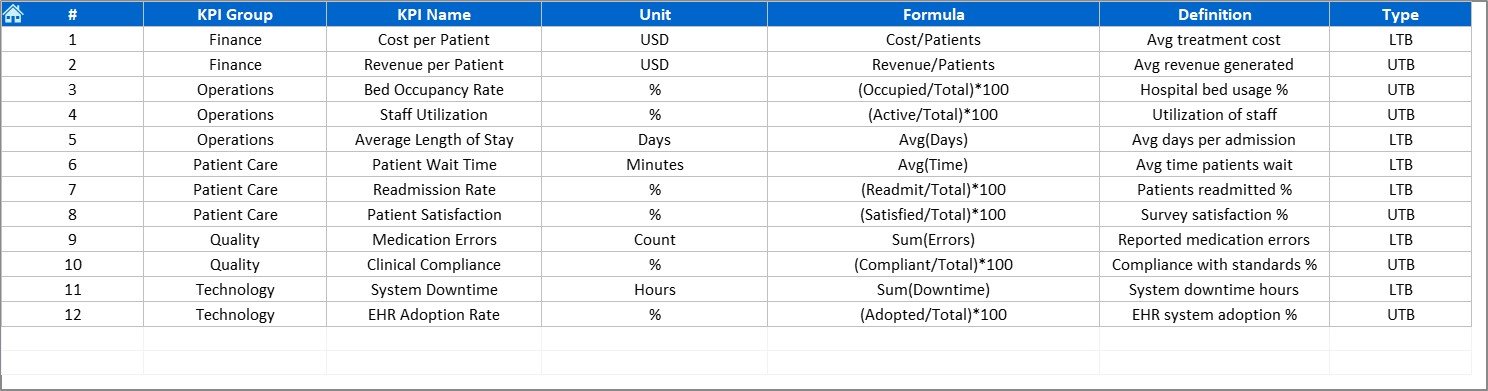
✅ Clear KPI Library – Definitions, formulas, and units included for consistency.
This dashboard doesn’t just display numbers—it tells a story of customer service performance.Customer Complaint Resolution KPI Dashboard In Excel
📦 What’s Inside the Customer Complaint Resolution KPI Dashboard
When you download this product, you’ll get a structured Excel file with:
-
Home Sheet – Index page with six navigation buttons for easy access.
-
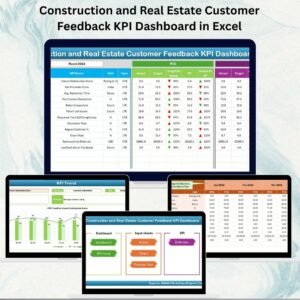
Dashboard Sheet – The main visualization hub with MTD vs Target vs PY insights.
-
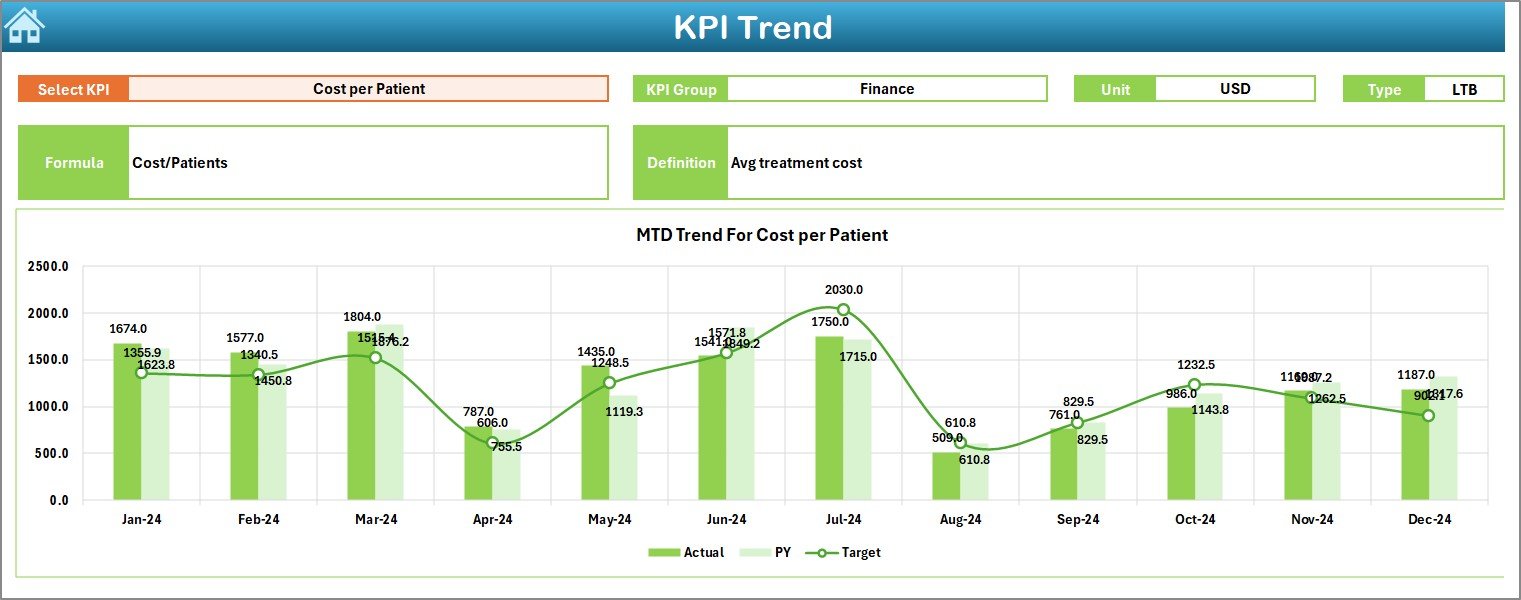
KPI Trend Sheet – Drill down into specific KPIs with interactive trend charts.
-
Actual Numbers Input Sheet – Enter month-wise MTD and YTD data.
-
Target Sheet – Define and manage your monthly targets.
-
Previous Year Sheet – Historical performance tracking for year-on-year comparison.
-
KPI Definition Sheet – Standardized KPI reference with formulas, units, and types.
Everything is built to be intuitive, easy to use, and adaptable to your unique needs.Customer Complaint Resolution KPI Dashboard In Excel
🛠️ How to Use the Customer Complaint Resolution KPI Dashboard
-
Input Data – Enter actual values in the Actual Numbers Input sheet.
-
Set Targets – Define benchmarks in the Target sheet for clear goals.
-
Compare Trends – Analyze month-wise and year-to-date results in the Dashboard.
-
Drill Down – Use the KPI Trend sheet to evaluate individual metrics.
-
Review Regularly – Update monthly to monitor progress and identify patterns.
-
Take Action – Use insights to reduce resolution delays, improve FCR, and boost CSAT.
Customer Complaint Resolution KPI Dashboard In Excel
👥 Who Can Benefit from This Dashboard
🎯 Customer Service Teams – Improve resolution times and accountability.
📊 Business Managers – Gain transparency into performance and bottlenecks.
🏢 SMEs & Enterprises – Standardize complaint handling across departments.
📈 Quality & Compliance Officers – Track and report with accuracy.
🧑💻 CX Analysts – Identify patterns, root causes, and areas for improvement.
If your business values customer loyalty, this dashboard is your essential toolkit.
✅ Click here to read the Detailed blog post
Watch the step-by-step video tutorial:


Reviews
There are no reviews yet.