In the high-stakes world of crowdfunding, success depends on more than just a great pitch—it requires real-time insight into your campaign’s performance. That’s where the Crowdfunding KPI Dashboard in Power BI becomes your most valuable tool. 🎯📊
This ready-to-use, Excel-powered Power BI dashboard is designed to help you track, visualize, and optimize every crucial metric related to your crowdfunding campaigns—from funding progress and engagement to conversion trends and social reach. No coding, no complexity—just plug in your Excel data and watch your dashboard come to life!
✨ Key Features of the Crowdfunding KPI Dashboard
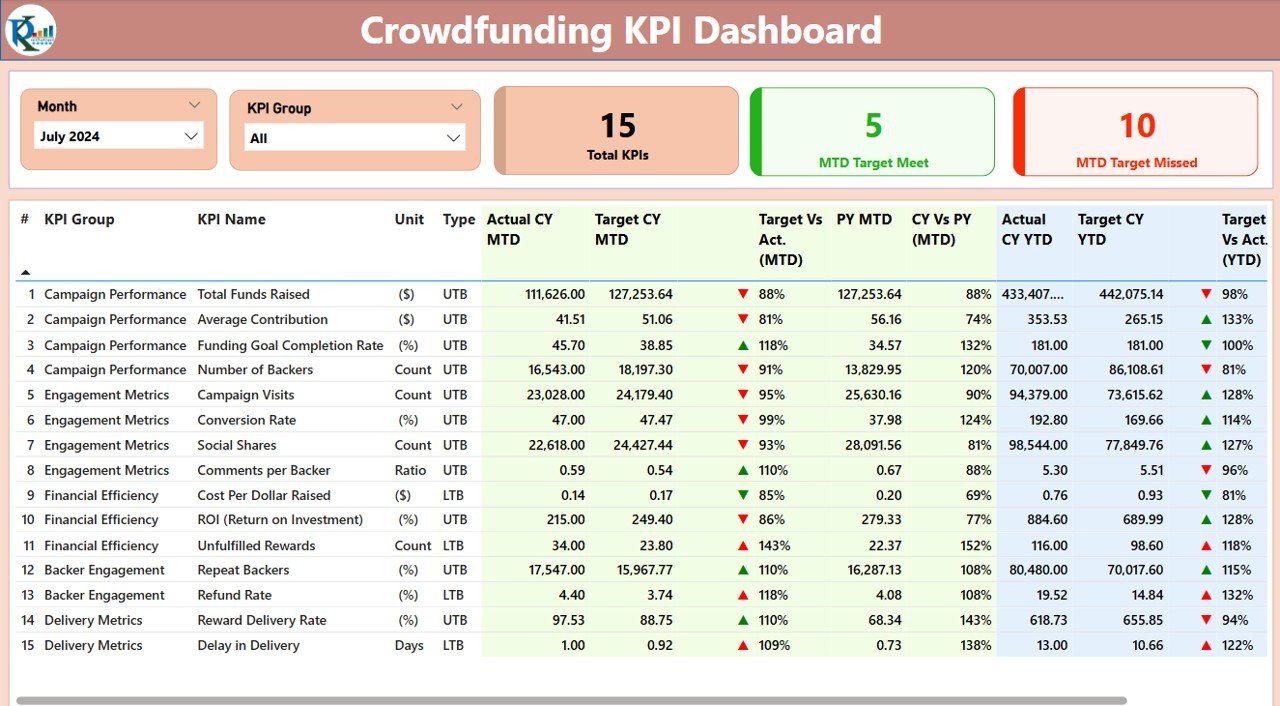
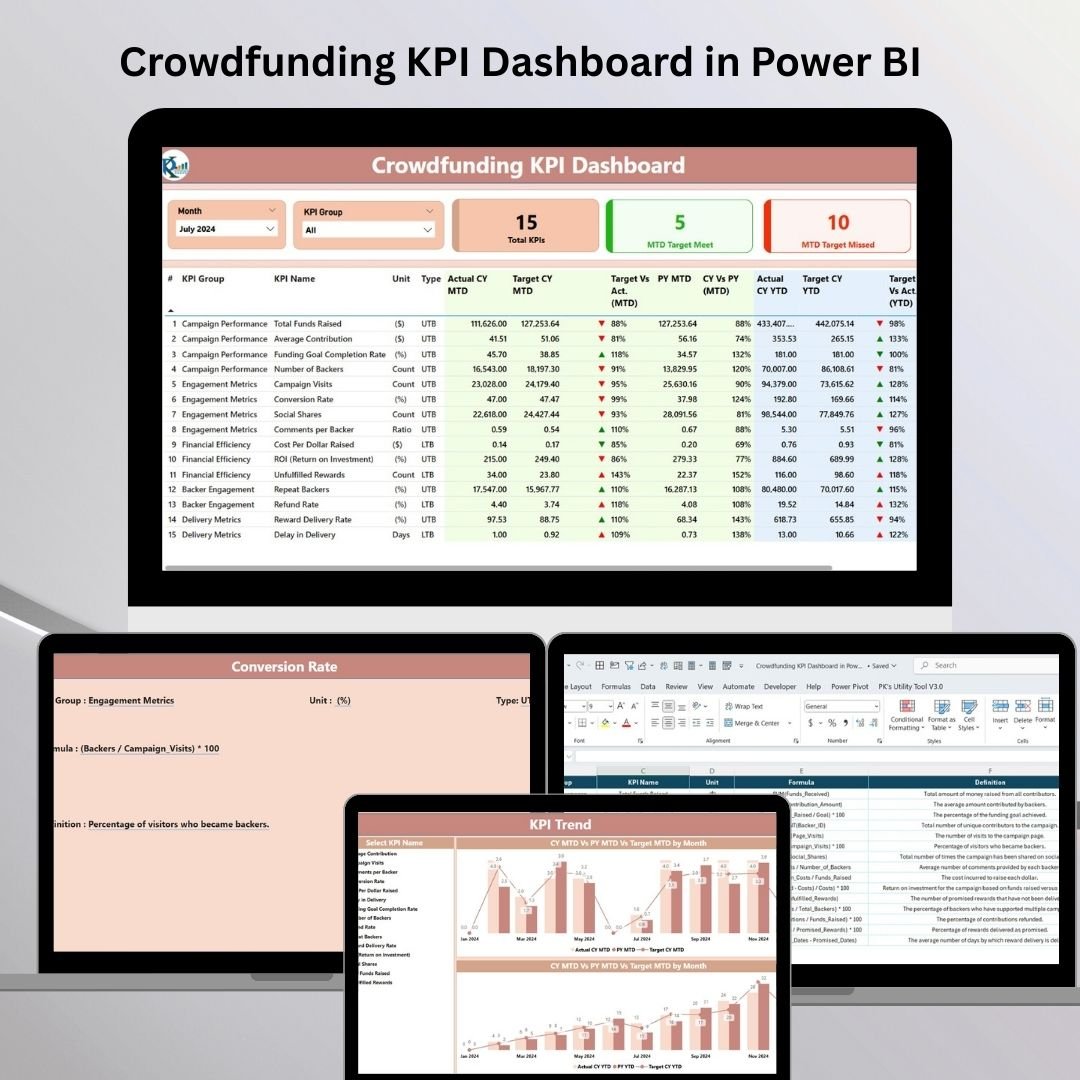
📋 Summary Page – Your KPI Control Room
-
🎛️ Dynamic Slicers – Filter by Month and KPI Group
-
🧮 KPI Cards – Instantly see:
-
Total KPIs Tracked
-
KPIs Meeting Targets
-
KPIs Missing Targets
-
-
📊 Auto-Refreshing KPI Table – Includes:
-
KPI Name, Unit, Type (UTB/LTB)
-
MTD & YTD values with icons (⬆️/⬇️) for visual clarity
-
Comparisons with previous year performance
-
% Achieved metrics
-
This page helps you make data-driven decisions quickly with color-coded, visual indicators.
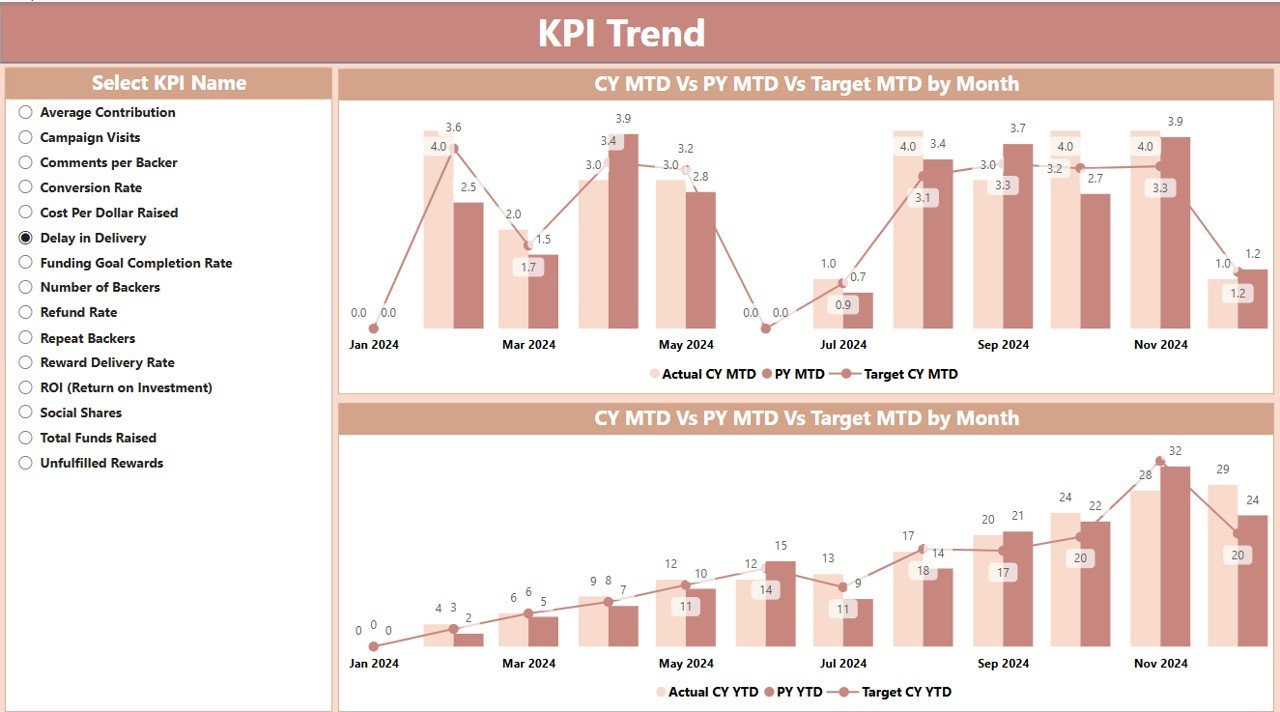
📈 KPI Trend Page – Visualize Growth & Identify Gaps
Use a slicer to select any KPI and instantly view:
-
📅 Month-to-Date (MTD) comparisons: Current Year vs. Target vs. Previous Year
-
📆 Year-to-Date (YTD) performance trends
Identify patterns and optimize your strategy—before it’s too late.
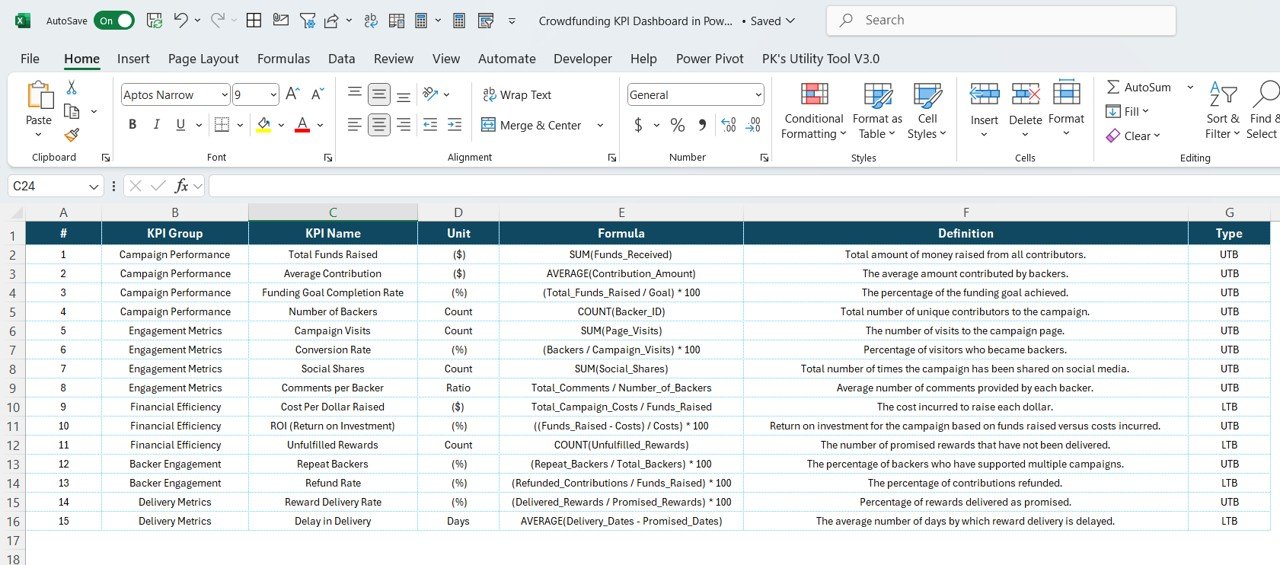
📘 KPI Definition Page – Know What You’re Tracking
Drill through from the main dashboard into this reference sheet to access:
-
📐 KPI Formula
-
📄 Clear Definition
-
⚖️ KPI Type – Lower The Better (LTB) or Upper The Better (UTB)
-
📏 Unit of Measurement
This page ensures team-wide alignment and clarity on what each KPI means.
🧾 Excel-Powered Data Source – No Coding Needed!
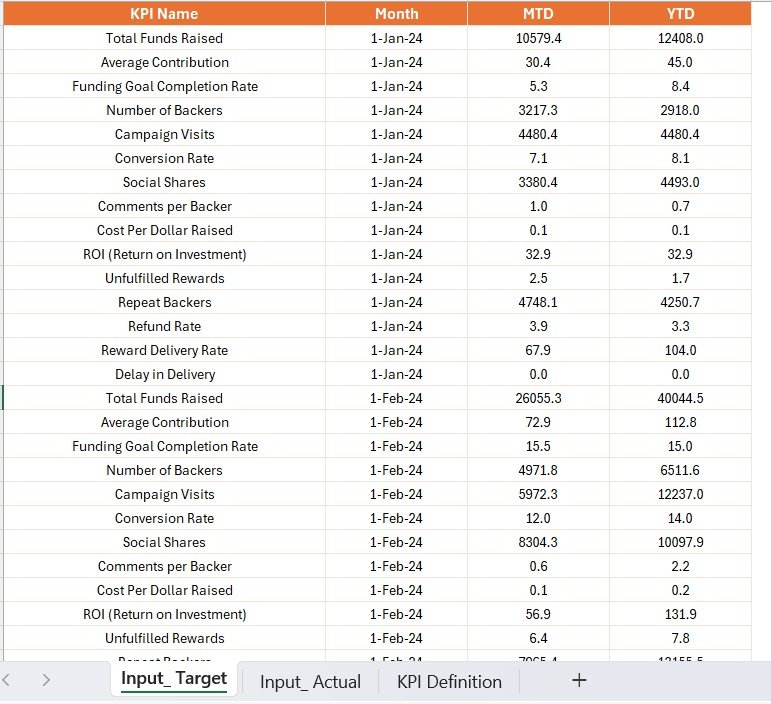
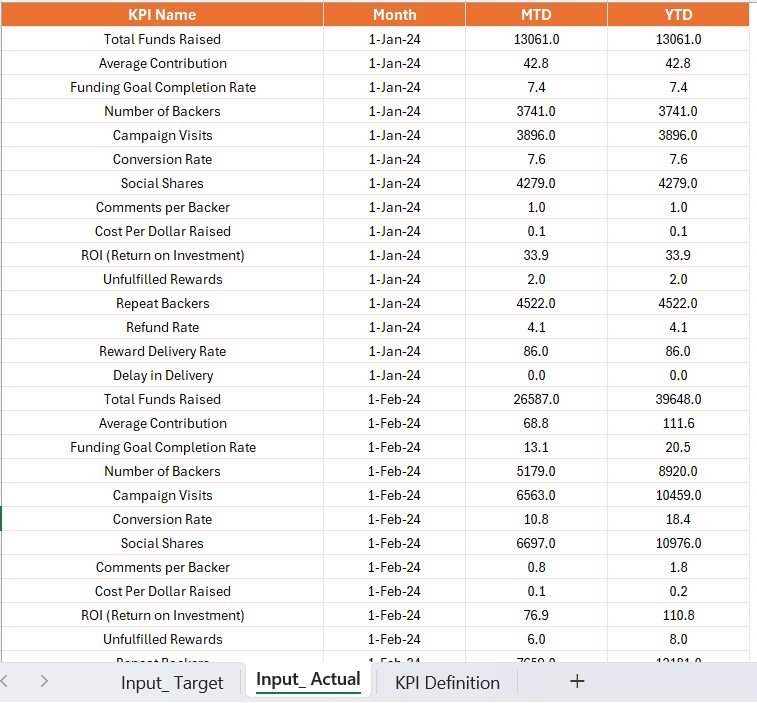
The dashboard updates in real-time based on data entered in three Excel sheets:
-
✅ Input_Actual – Enter MTD and YTD actual values per month
-
🎯 Input_Target – Record target values for each KPI
-
📚 KPI_Definition – Maintain all KPI logic in one place
Use the 1st of each month for all dates to ensure consistency.
🚀 Advantages of the Crowdfunding KPI Dashboard
✅ Real-Time Monitoring – Instantly see which campaigns are performing
📊 Excel Simplicity – Update numbers easily—no complex setup
🎨 Powerful Visuals – Icons, charts, and tables that highlight performance
📅 MTD & YTD Tracking – Monitor both short-term and long-term progress
🔄 Drill-Down Functionality – Dive deep into each KPI with just one click
🔧 Fully Customizable – Add more KPIs, tweak visuals, or update calculations
📤 Share-Ready for Teams – Present reports that impress backers and stakeholders
🎯 Who Can Use This Dashboard?
This tool is perfect for:
-
📢 Campaign Managers
-
🤝 Nonprofits
-
💼 Startup Founders
-
💡 Creators & Innovators
-
🎬 Film & Art Project Coordinators
If you’re raising money and managing campaign KPIs, this dashboard is built for you.
🧠 Best Practices for Crowdfunding KPI Tracking
🔄 Update Monthly – Refresh Excel data to keep visuals accurate
🎯 Align KPIs with Goals – Track only metrics that support success
📤 Share with Stakeholders – Use visuals to communicate clearly
🧹 Keep it Clean – Limit noise by avoiding vanity metrics
📌 Use Definitions – Ensure the team understands what each KPI measures
🔗 Click here to read the Detailed blog post
📺 Visit our YouTube channel to learn step-by-step video tutorials













Reviews
There are no reviews yet.