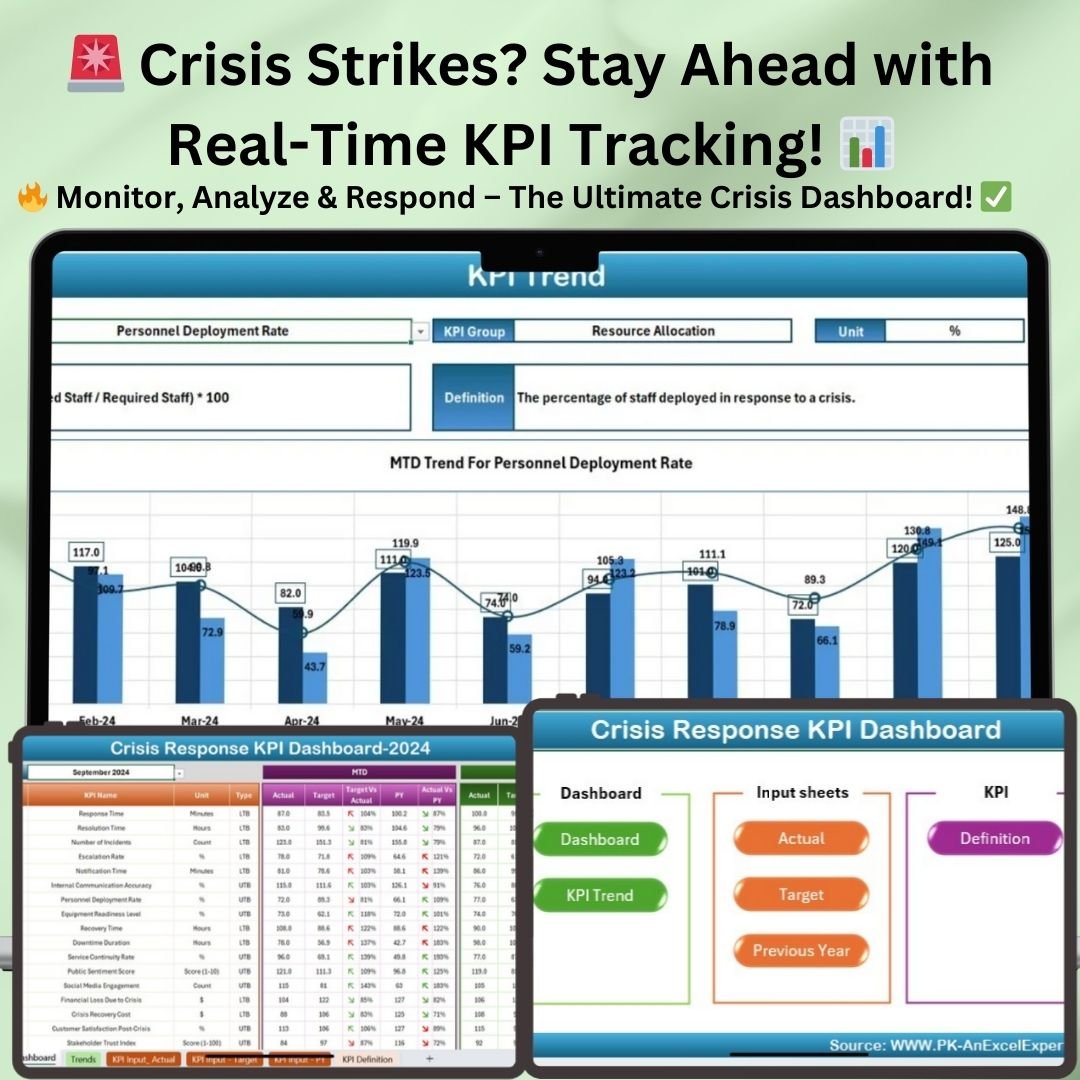
In times of crisis, having a structured approach to response and management is critical. Our Crisis Response KPI Dashboard in Excel is a fully automated, easy-to-use tool that provides real-time monitoring of key performance indicators (KPIs) related to crisis response, stakeholder engagement, resource allocation, and financial impact.
This dashboard is designed to help organizations track, analyze, and improve their crisis response strategies by offering MTD (Month-to-Date) and YTD (Year-to-Date) performance comparisons with clear trend analysis.
With seven well-structured worksheets, this ready-to-use dashboard enables businesses, government agencies, and emergency response teams to make informed decisions during critical situations.
Key Features of the Crisis Response KPI Dashboard
This Excel-based KPI dashboard is built for efficiency and effectiveness. It includes:
1. Home Sheet (Navigation Panel)

- Acts as a central hub with quick-access buttons for different sheets.
- Ensures seamless navigation and enhanced user experience.
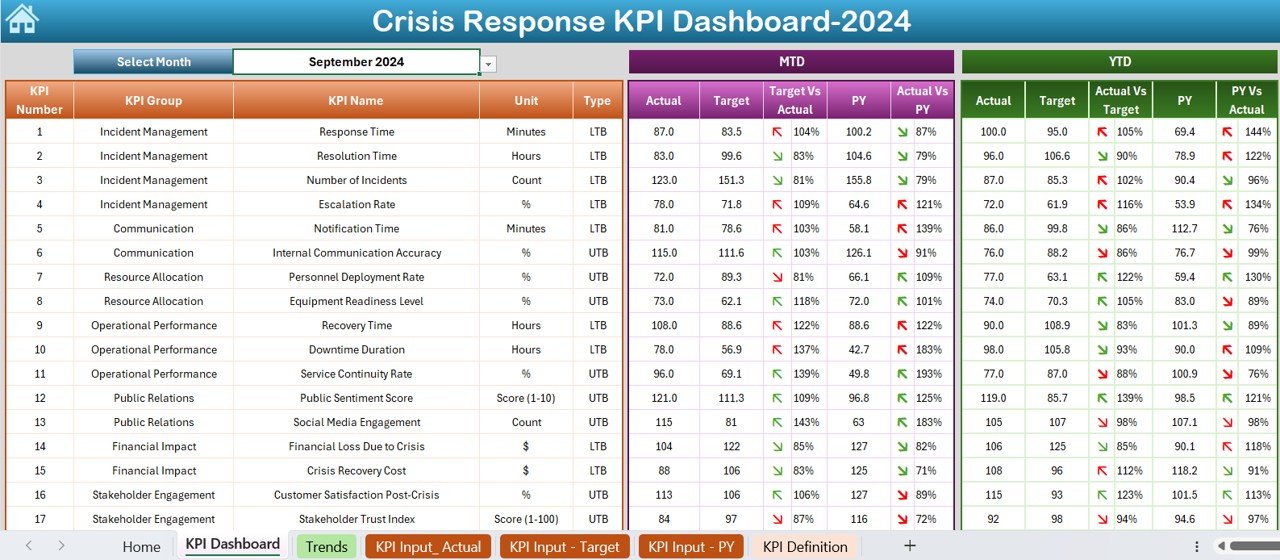
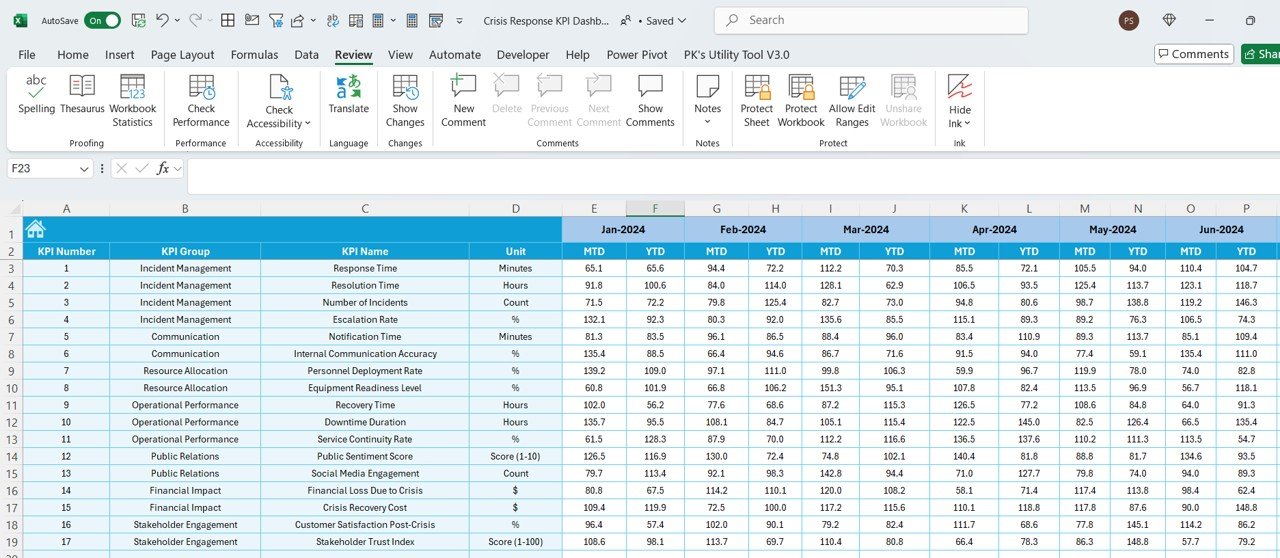
2. Dashboard Sheet (Main Performance Overview)
- Displays all critical KPIs in an easy-to-read format.
- Users can select any month from a drop-down list for instant data filtering.
- Provides Month-to-Date (MTD) and Year-to-Date (YTD) comparisons, including:
- Actuals vs. Targets
- Actuals vs. Previous Year (PY) Data
- Features conditional formatting indicators (up/down arrows) to highlight KPI trends.
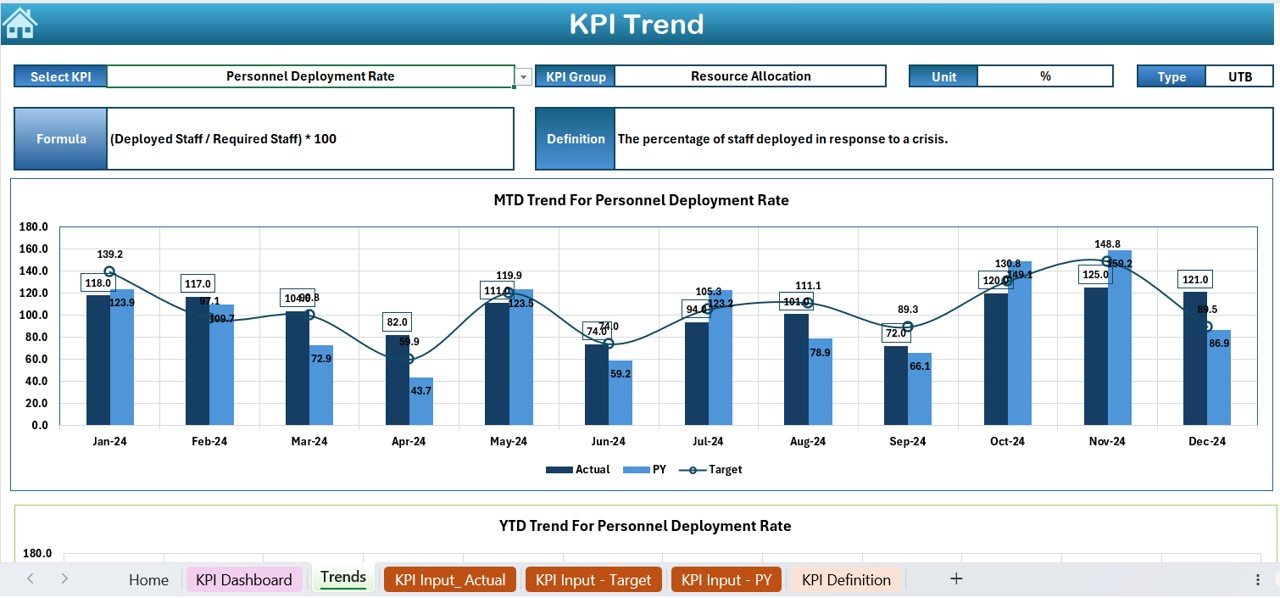
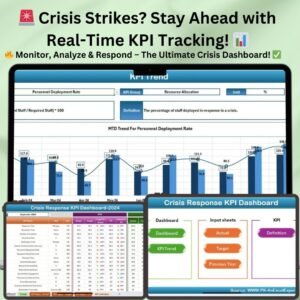
3. KPI Trend Sheet (Advanced Data Visualization)
- Users can select a KPI from a drop-down list to view detailed performance trends.
- Displays KPI-related information:
- KPI Group
- Unit of Measurement
- Formula Used
- Performance Trends (MTD and YTD)
- Visualizes KPI performance over time with interactive trend charts.
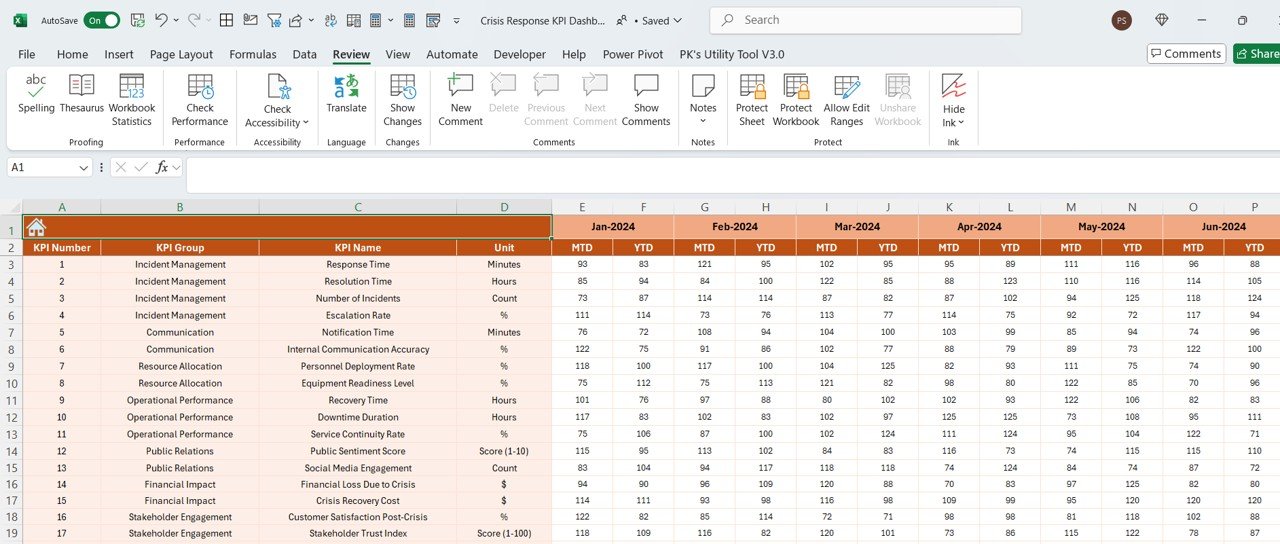
4. Actual Numbers Input Sheet (Real-Time Data Entry)
- Users can manually input actual KPI values for MTD and YTD performance.
- Month selection option enables flexible data updates.
5. Target Sheet (Goal Setting)
- Allows users to define target values for each KPI, ensuring performance tracking against set goals.
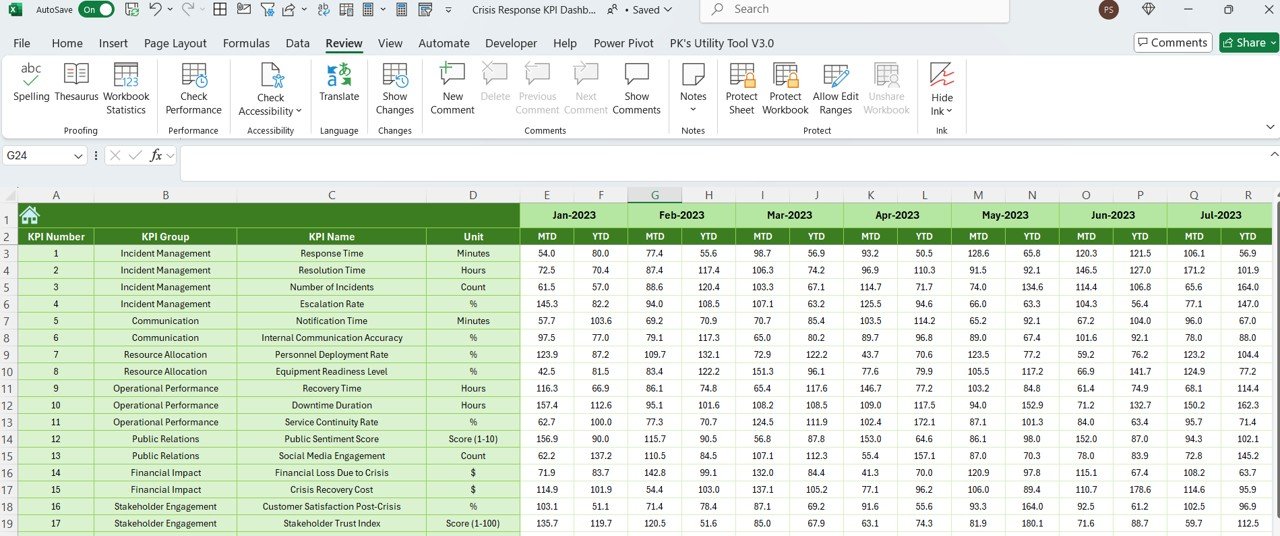
6. Previous Year Number Sheet (Historical Benchmarking)
- Stores historical KPI data for comparative performance analysis.
- Helps businesses track improvements and identify trends over time.
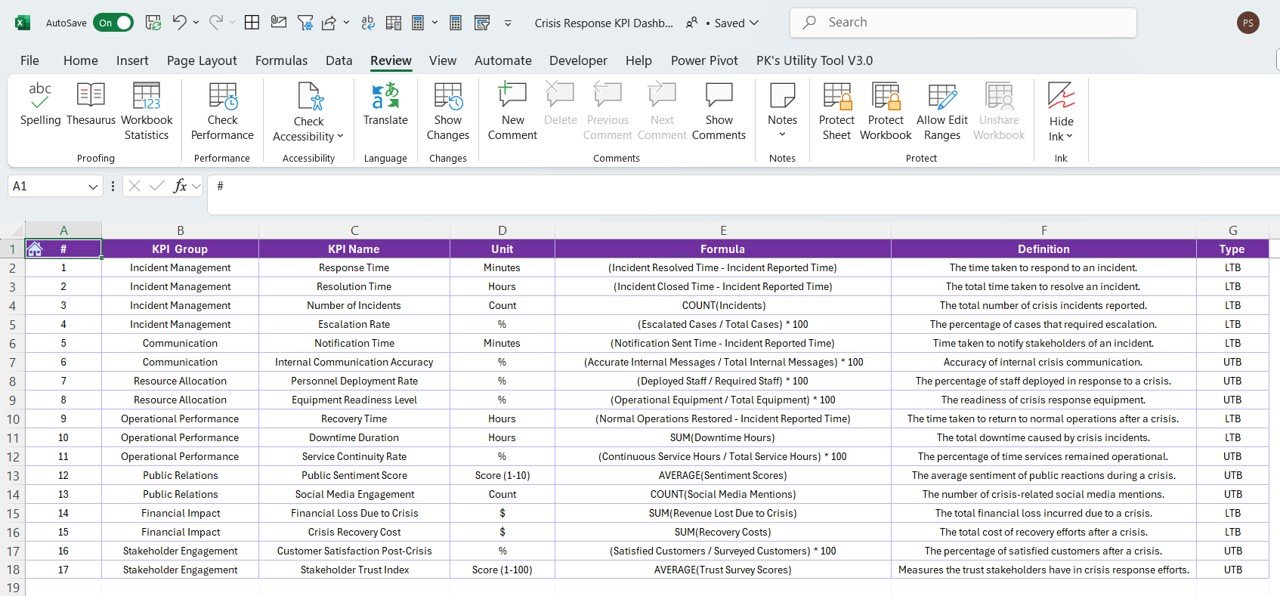
7. KPI Definition Sheet (Comprehensive KPI Repository)
- Maintains a centralized list of KPIs, including:
- KPI Name
- KPI Group
- Unit of Measurement
- Formula Used
- Performance Definition
- Ensures consistency in KPI tracking and reporting.
Why Choose This Crisis Response KPI Dashboard?
This Excel KPI Dashboard is perfect for teams managing crisis response operations. Here’s why:
✅ Real-Time Crisis Monitoring – Track critical KPIs and respond faster to crisis situations.
✅ Automated Data Analysis – Pre-built formulas calculate and compare performance instantly.
✅ Visual KPI Trends – Identify performance gaps with trend charts.
✅ Customizable & Scalable – Modify or expand KPI lists to match business needs.
✅ User-Friendly Navigation – Simple drop-down selections and clickable buttons for easy use.
How to Use the Crisis Response KPI Dashboard?
Step 1: Input Actual KPI Data
- Enter real-time MTD and YTD actual numbers in the Actual Numbers Input Sheet.
- Update the Previous Year Data Sheet for historical comparisons.
Step 2: Set KPI Targets
- Define monthly and yearly targets in the Target Sheet to compare against actuals.
Step 3: Analyze Performance Trends
- Use the KPI Trend Sheet to visualize patterns and identify problem areas.
- Compare Actual vs. Target and Actual vs. Previous Year to spot deviations.
Step 4: Track KPI Trends on the Dashboard
- Navigate to the Dashboard Sheet to get a real-time snapshot of performance.
- Use conditional formatting indicators to quickly assess areas needing attention.
Step 5: Improve Decision-Making
- Leverage historical and real-time insights to optimize crisis management strategies.
- Make data-driven decisions for better resource allocation and crisis mitigation.
Who Can Benefit from This KPI Dashboard?
This Crisis Response KPI Dashboard is ideal for:
✔ Disaster & Emergency Response Teams – Monitor incident resolution times & resource deployment.
✔ Government Agencies – Track public relations impact and stakeholder engagement.
✔ Corporate Risk Management Teams – Reduce operational downtime & financial loss.
✔ Crisis Management Consultants – Use real-time data to advise businesses on crisis response strategies.
✔ Project Managers & Business Leaders – Ensure KPI targets align with organizational goals.
Frequently Asked Questions (FAQs)
1. Can I customize this Crisis Response KPI Dashboard?
Yes! This Excel-based dashboard is fully customizable. You can add, modify, or remove KPIs, change formulas, and update data fields as needed.
2. Does this template require Excel expertise?
Not at all! The dashboard is designed for ease of use. With drop-down selections, pre-built formulas, and automation, even users with basic Excel skills can navigate it effortlessly.
3. What versions of Excel does this template support?
It works with Microsoft Excel 2016, 2019, and Office 365 (Windows & Mac).
4. Can I use this for multiple teams or departments?
Absolutely! You can duplicate the template for different teams, making it useful for large organizations managing multiple crisis response units.
5. Is this a one-time purchase?
Yes! Pay once and get lifetime access to the template with no recurring fees.
Click hare to read the Detailed blog post
Visit our YouTube channel to learn step-by-step video tutorials


Reviews
There are no reviews yet.