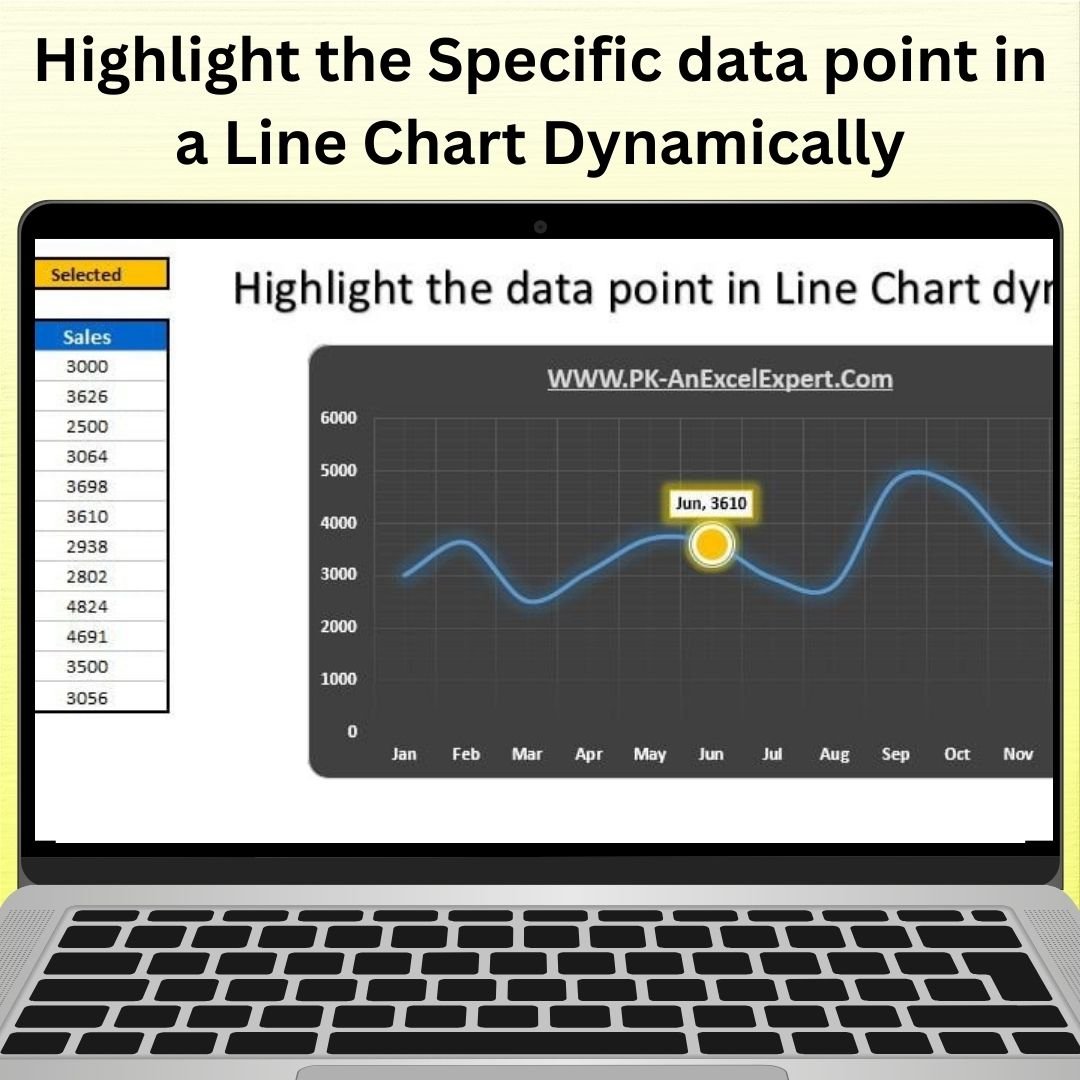
The Highlight the Specific Data Point in a Line Chart Dynamically tool in Excel is a powerful solution for visually emphasizing key data points in your line charts. Whether you’re analyzing sales trends, project milestones, or performance metrics, this dynamic feature allows you to automatically highlight and draw attention to any specific data point in your chart as the data changes. This feature is perfect for business analysts, project managers, or anyone who needs to track performance over time and focus on key events or thresholds.
With the ability to dynamically highlight data points based on your input, this tool allows for real-time updates. The chart adjusts automatically to reflect changes in the data, ensuring that the highlighted data points are always up-to-date. It helps you focus on important trends, outliers, or significant events that need immediate attention.
Key Features of the Highlight the Specific Data Point in a Line Chart Dynamically
📌 Dynamic Data Point Highlighting
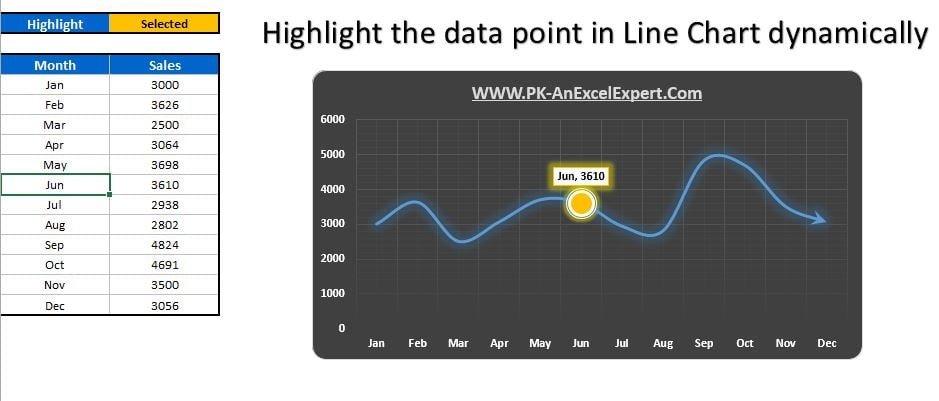
This tool automatically highlights specific data points in your line chart based on your predefined conditions. Whether you want to emphasize the highest value, a specific date, or a critical milestone, this tool ensures those points are highlighted dynamically as the data changes.
🛠 Customizable Highlighting Criteria
You can set up customized rules for highlighting data points. Whether you want to highlight values above a certain threshold, show data for a specific period, or highlight key milestones, you have full control over how and when data points are highlighted.
💡 Real-Time Data Updates
As you update your data, the highlighted points are automatically adjusted in real-time. This ensures that your chart always reflects the most current data, helping you stay on top of performance metrics, trends, and important events without manual updates.
🔢 Visually Compelling Presentation
With dynamic highlighting, your charts become more engaging and visually compelling. The highlighted points stand out, drawing attention to key areas of interest, making it easier for stakeholders to understand and interpret the data.
🚀 Perfect for Performance Tracking
Ideal for tracking KPIs, sales progress, or project milestones, this tool lets you dynamically track and highlight the most important data points over time. Use it for everything from monthly sales reports to project progress tracking.
📊 Customizable Design Options
The tool comes with flexible design options, allowing you to customize the colors, markers, and labels for the highlighted data points. This makes it easy to match the chart with your branding, reporting style, or visual preferences.
⚙ User-Friendly Setup
Despite its powerful features, this tool is easy to set up and use. Whether you’re an Excel beginner or an advanced user, the step-by-step instructions make it simple to apply this dynamic feature to your charts.
🚀 Why You’ll Love Highlighting the Specific Data Point in a Line Chart Dynamically
✅ Dynamic Highlighting – Automatically highlight key data points based on your conditions. ✅ Customizable Criteria – Set up your own rules for when data points are highlighted. ✅ Real-Time Updates – The chart automatically updates as your data changes. ✅ Visually Compelling – Draw attention to the most important data points. ✅ Perfect for Performance Tracking – Track sales, KPIs, and project progress effectively. ✅ Simple Setup – Easy to apply and customize in just a few steps.
📂 What’s Inside the Highlight the Specific Data Point in a Line Chart Dynamically Tool?
- Dynamic Line Chart: A line chart that highlights specific data points as defined by your criteria.
- Customizable Highlighting Rules: Set your own rules for when and how data points are highlighted.
- Real-Time Data Updates: The chart automatically adjusts as your data changes.
- Step-by-Step Setup Instructions: Clear and concise instructions for setup.
🔍 How to Use the Highlight the Specific Data Point in a Line Chart Dynamically Tool
1️⃣ Download the Template – Instant access to the Excel file upon purchase. 2️⃣ Input Your Data – Enter your data points into the line chart. 3️⃣ Set Your Highlighting Criteria – Define the rules for when and how data points should be highlighted. 4️⃣ Track and Monitor – Watch as the chart updates automatically to highlight the key data points. 5️⃣ Present and Share – Use the dynamic chart in your reports or dashboards to emphasize important metrics.
🎯 Who Can Benefit from Highlighting the Specific Data Point in a Line Chart Dynamically? 🔹 Business Analysts
🔹 Project Managers
🔹 Sales Teams
🔹 Marketing Teams
🔹 Financial Analysts
🔹 Anyone needing to track and highlight specific trends, performance metrics, or milestones
The Highlight the Specific Data Point in a Line Chart Dynamically tool in Excel is an excellent way to track and emphasize important data points, making it easier to communicate key insights to stakeholders and decision-makers.
Click here to read the Detailed blog post
https://www.pk-anexcelexpert.com/highlight-the-specific-data-point-in-a-line-chart-dynamically/


Reviews
There are no reviews yet.